Calculating the energy and power of a signal was discussed in one of the previous posts. Here, we will verify the calculation of signal power using Discrete Fourier Transform (DFT) in Matlab. Check here to know more on the concept of power and energy.
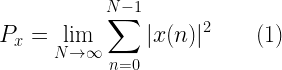
The total power of a signal can be computed using the following equation

For other forms of equations: refer here.
This article is part of the following books |
Case Study:
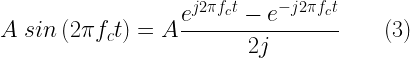
Let x(t) be a sine wave of amplitude A and frequency fc represented by the following equation.


When represented in frequency domain, it will look like the one on the right side plot in the following figure. This is evident from the fact that the sinewave can be mathematically represented by applying Euler’s formula.

Taking the Fourier transform of x(t) to represent it in frequency domain,

![\begin{aligned} X(f) &= F \left[ A\; sin \left( 2 \pi f_c t \right)\right] \\ &= \int_{- \infty}^{\infty} \left[ \frac{e^{j 2 \pi f_c t} - e^{-j 2 \pi f_c t} }{2 j} \right] e^{- j 2 \pi f t} \\ &= \frac{A}{ 2 j } \left[ \delta (f - f_c) - \delta (f + f_c) \right] \end{aligned} \quad\quad (4)](https://s0.wp.com/latex.php?latex=%5Cbegin%7Baligned%7D+X%28f%29+%26%3D+F+%5Cleft%5B+A%5C%3B+sin+%5Cleft%28+2+%5Cpi+f_c+t+%5Cright%29%5Cright%5D+%5C%5C+%26%3D+%5Cint_%7B-+%5Cinfty%7D%5E%7B%5Cinfty%7D+%5Cleft%5B++%5Cfrac%7Be%5E%7Bj+2+%5Cpi+f_c+t%7D+-+e%5E%7B-j+2+%5Cpi+f_c+t%7D+%7D%7B2+j%7D++%5Cright%5D+e%5E%7B-+j+2+%5Cpi+f+t%7D+%5C%5C+%26%3D+%5Cfrac%7BA%7D%7B+2+j+%7D+%5Cleft%5B+%5Cdelta+%28f+-+f_c%29+-+%5Cdelta+%28f+%2B+f_c%29+%5Cright%5D+%5Cend%7Baligned%7D+%5Cquad%5Cquad+%284%29++&bg=ffffff&fg=000&s=2&c=20201002)
When considering the amplitude part,the above decomposition gives two spikes of amplitude A/2 on either side of the frequency domain at fc and -fc.


Squaring the amplitudes gives the magnitude of power of the individual spikes/frequency components. The power spectrum is plotted below.


Thus if the pure sinewave is of amplitude A=1V and frequency=100Hz, the power spectrum will have two spikes of value


Let’s verify this through simulation.
Simulation and Verification
A sine wave of 100 Hz frequency and amplitude 1V is taken for the experiment.
A=1; %Amplitude of sine wave
Fc=100; %Frequency of sine wave
Fs=1000; %Sampling rate - oversampled by the rate of 10
Ts=1/Fs; %Sampling period
nCycles=200; %Number of cycles of the sinewave

subplot(2,1,1);
t=0:Ts:nCycles/Fc-Ts; %Time base
x=A*sin(2*pi*Fc*t); %Sinusoidal function
stem(t,x); %Plot command
A sinusoidal wave of 10 cycles is plotted here


Matlab’s Norm function:
Matlab’s basic installation comes with “norm” function. The p-norm in Matlab is computed as


By default, the single argument norm function computed 2-norm given as


To compute the total power of the signal x[n] (as in equation (1) above), all we have to do is – compute norm(x), square it and divide by the length of the signal.
L=length(x);
P=(norm(x)^2)/L;
sprintf('Power of the Signal from Time domain %f',P);
The above given piece of code will result in the following output
Power of the Signal from Time domain 0.500000Verifying the total Power by DFT : Frequency Domain
Here, the total power is verified by applying DFT on the sinusoidal sequence. The sinusoidal sequence x[n] is represented in frequency domain X[f] using Matlab’s FFT function. The power associated with each frequency point is computed as

![P_x [f] = X[f] X^\ast [f]](https://s0.wp.com/latex.php?latex=P_x+%5Bf%5D+%3D+X%5Bf%5D+X%5E%5Cast+%5Bf%5D++&bg=ffffff&fg=000&s=2&c=20201002)
Finally, the total power is calculated as the sum of all the points in the frequency domain representation.
X = fft(x);
Px=sum(X.*conj(X))/(L^2); %Compute power with proper scaling.
subplot(2,1,2)
% Plot single-sided amplitude spectrum.
stem(Px);
sprintf('Total Power of the Signal from DFT %f',P);
Result:
Total Power of the Signal from DFT 0.500000

A word on Matlab’s FFT: Matlab’s FFT is optimized for faster performance if the transform length is a power of 2. The following snippet of code simply calls “fft” without the transform length. In this case, the window length and the transform length are the same. This is to simplify the calculation of power. You can re-write the call to the FFT routine with transform length set to next power of two which is greater than or equal to the window length (sequence length). Then the step to compute total power will be differing slightly in the denominator. But that will not improve resolution (Remember : zero padding to compute FFT will not improve resolution).
Also note that in the above simulation we are using a pure sinusoid. The entire sequence of sinusoid defined all the cycles completely. There are no discontinuities in the sequence. If you call FFT with the transform length set to next power of 2 (as given in Matlab manuals), it will pad additional zeros to the sequence and creates discontinuities in the FFT computation. This will lead to spectral leakage. FFT and spectral leakage is discussed here.
Rate this article: Note: There is a rating embedded within this post, please visit this post to rate it.
References:
[1] Sanjay Lall,”Norm and Vector spaces”,Information Systems Laboratory,Stanford University.↗
Books by the author
 Wireless Communication Systems in Matlab Second Edition(PDF) Note: There is a rating embedded within this post, please visit this post to rate it. |  Digital Modulations using Python (PDF ebook) Note: There is a rating embedded within this post, please visit this post to rate it. |  Digital Modulations using Matlab (PDF ebook) Note: There is a rating embedded within this post, please visit this post to rate it. |
| Hand-picked Best books on Communication Engineering Best books on Signal Processing |
||


