Simulate matched filter system with SRRC filtering

Key focus: Let’s learn how to simulate matched filter receiver with square root raised cosine (SRRC) filter, for a pulse amplitude modulation (PAM) system.

Simulation Model

A basic pulse amplitude modulation (PAM) system as DSP implementation, is shown in Figure 1 by adding an upsampler (), pulse shaping function () at the transmitter and a matched filter (), downsampler () combination at the receiver.

DSP implementation of a PAM modulation system with pulse shaping and matched filtering
Figure 1: DSP implementation of a PAM modulation system with pulse shaping and matched filtering

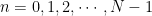
In this model, a random stream of source bits is first segmented into -bit wide symbols that can take any value from the set . The simulation code directly starts by generating a random set of symbols, that goes into the modulation mapper. Pulse amplitude modulation (MPAM) mapping and de-mapping, described in sections 5.3.1 and 5.4.1, are considered here for simulation. An MPAM modulator maps the -bit information symbols to one of the distinct signaling levels. The MPAM modulated symbols are shown in Figure 2.

This article is part of the book Wireless Communication Systems in Matlab, ISBN: 978-1720114352 available in ebook (PDF) format (click here) and Paperback (hardcopy) format (click here).

%Program: MPAM modulation
N = 10ˆ5; %Number of symbols to transmit
MOD_TYPE = 'PAM'; %modulation type
M = 4; %modulation level for the chosen modulation MOD_TYPE
d = ceil(M.*rand(1,N)); %random numbers from 1 to M for input to PAM
u = modulate(MOD_TYPE,M,d);%MPAM modulation
figure; stem(real(u)); %plot modulated symbols
Figure 2: M-PAM modulated Symbols

Each MPAM modulated symbol should last for some duration called symbol time, denoted as . Each modulated symbol will go through a discrete time pulse shaping filter whose impulse response is spaced sample, where denotes the sampling period. To do this, the incoming symbols from the modulation mapper need to be converted to discrete time impulse train by upsampling them by a factor (as per the upsampling equation given here ). The upsampler inserts zeros between each modulated symbols. In practice, is chosen as integral multiples of 4. The upsampler/oversampled output is shown in Figure 3.

%Program: Upsampling
L=4; %Oversampling factor (L samples per symbol period)
v=[u;zeros(L-1,length(u))];%insert L-1 zero between each symbols
%Convert to a single stream
v=v(:).';%now the output is at sampling rate
stem(real(v)); title('Oversampled symbols v(n)');
Figure 3: Modulated symbols upsampled by 4 (left) and the SRRC pulse shaping filter output (right)

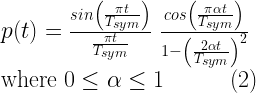
In order to fill-in proper values in place of the inserted zeros, interpolation is performed by a pulse shaping filter by convolving the output of the upsampler and the pulse shaping function. The pulse shaping function needs to satisfy Nyquist criterion for zero ISI, otherwise, aliasing effect will wreak havoc. If the amplitude response of the channel is flat and if the noise is white, then the amplitude response of the pulse shaping function can be split equally between the transmitter and receiver. For this simulation the desired Nyquist pulse shape is a raised-cosine pulse shape and the task of raised-cosine filtering is equally split between the transmit and receive filters. This gives rise to square-root raised-cosine (SRRC) filters at the transmitter and receiver. This is a matched filter system, where the receive filter is matched with the transmit pulse shaping filter.

A matched filtering system is a theoretical framework and it is not a specific type of filter. It offers improved noise cancellation by improving the signal noise ratio at the output of the receive filter. The implementation starts with the design of an SRRC filter with roll-off factor . The SRRC filter length is influenced by the parameter – the span of the filter length in units of symbols and the oversampling factor .

Filters will not produce instantaneous output and they take sometime to produce the output. That is, the output of the filter is shifted in time with respect to the input. For symmetric FIR filters of length , the filter delay is . Apart from returning the SRRC pulse function, the filter design function given in this section returns the filter delay. Filter delays are useful in determining the appropriate sampling instances at the receiver. The modulated symbols at the transmitter are passed through the designed filter and the response of the filter is plotted in Figure 3 (right).

%Program: SRRC pulse shaping
%----Pulse shaping-----
beta = 0.3;% roll-off factor for Tx SRRC filter
Nsym=8;%SRRC filter span in symbol durations
L=4; %Oversampling factor (L samples per symbol period)
[p,t,filtDelay] = srrcFunction(beta,L,Nsym);%design filter
s=conv(v,p,'full');%Convolve modulated syms with p[n] filter
figure; plot(real(s),'r'); title('Pulse shaped symbols s(n)');
Figure 4: Received signal with AWGN noise (left) and the output of the matched filter (right)

The pulse shaped signal samples are sent through an AWGN channel, where the transmitted samples are added with noise samples that are generated according to the required (refer AWGN noise model given in this post). The received signal that is corrupted with AWGN noise is shown in Figure 4 (left).

%Program: Adding AWGN noise for given SNR value
EbN0dB = 10; %EbN0 in dB for AWGN channel
snr = 10*log10(log2(M))+EbN0dB; %Converting given Eb/N0 dB to SNR
%log2(M) gives the number of bits in each modulated symbol
r = add_awgn_noise(s,snr,L); %AWGN , add noise for given SNR, r=s+w
%L is the oversampling factor used in simulation
figure; plot(real(r),'r');title('Received signal r(n)');

For the receiver system, we assume that the ADC in the receiver produces an integer number of samples per symbol (i.e, is an integer). In practice, this is not always the case and thus a resampling filter is often included in real world designs. In the discrete time model, the received samples are passed through a matched filter, whose impulse response is matched to the impulse response of the pulse shaping filter as . Since the SRRC pulse is symmetric, we will be using the same SRRC pulse shaping function for the matched filter. The received samples are convolved with the matched filter and the output of the matched filter is shown in Figure 4 (right).

Refer the book Wireless Communication Systems in Matlab for the program on how to perform matched filtering

Next, we assume that the receiver has perfect knowledge of symbol timing instants and therefore, we will not be implementing a symbol timing synchronization subsystem in the receiver. At the receiver, the matched filter symbols are first passed through a downsampler that samples the filter output at correct timing instances.

The sampling instances are influenced by the delay of the FIR filters (SRRC filters in Tx and Rx). For symmetric FIR filters of length , the filter delay is . Since the communication link contains two filters, the total filter delay is . Therefore, the first valid sample occurs at position in the matched filter’s output vector ( is added due to the fact that Matlab array indices starts from 1). The downsampler that follows, starts to sample the signal from this position and returns every symbol. The downsampled output, shown in Figure 5, is then passed through a demodulator that decides on the symbols using an optimum detection technique and remaps them back to the intended message symbols.

Figure 5: Downsampling – output of symbol rate sampler
%Program: Symbol rate sampler and demodulation
%------Symbol rate Sampler-----
uCap = vCap(2*filtDelay+1:L:end-(2*filtDelay))/L;
%downsample by L from 2*filtdelay+1 position result by normalized L,
%as the matched filter result is scaled by L
figure; stem(real(uCap)); hold on;
title('After symbol rate sampler $\hat{u}$(n)',...
'Interpreter','Latex');
dCap = demodulate(MOD_TYPE,M,uCap); %demodulation

Rate this article: Note: There is a rating embedded within this post, please visit this post to rate it.

Books by the author


Wireless Communication Systems in Matlab
Second Edition(PDF)

(174 votes, average: 3.67 out of 5)

Checkout Added to cart

Digital Modulations using Python
(PDF ebook)

(127 votes, average: 3.58 out of 5)

Checkout Added to cart

Digital Modulations using Matlab
(PDF ebook)

(134 votes, average: 3.63 out of 5)

Checkout Added to cart
Hand-picked Best books on Communication Engineering
Best books on Signal Processing

Topics in this chapter

Pulse Shaping, Matched Filtering and Partial Response Signaling
● Introduction
● Nyquist Criterion for zero ISI
● Discrete-time model for a system with pulse shaping and matched filtering
 □ Rectangular pulse shaping
 □ Sinc pulse shaping
 □ Raised-cosine pulse shaping
 □ Square-root raised-cosine pulse shaping
● Eye Diagram
● Implementing a Matched Filter system with SRRC filtering
 □ Plotting the eye diagram
 □ Performance simulation
● Partial Response Signaling Models
 □ Impulse response and frequency response of PR signaling schemes
● Precoding
 □ Implementing a modulo-M precoder
 □ Simulation and results

Partial response (PR) signaling Model

Consider the generic baseband communication system model and its equivalent representation, shown in Figure 1, where the various blocks in the system are represented as filters. To have no ISI at the symbol sampling instants, the equivalent filter should satisfy Nyquist’s first criterion.

Figure 1: A generic communication system model and its equivalent representation

If the system is ideal and noiseless, it can be characterized by samples of the desired impulse response . Let’s represent all the non-zero sample values of the desired impulse response, taken at symbol sampling spacing , as , for .

This article is part of the book
Wireless Communication Systems in Matlab (second edition), ISBN: 979-8648350779 available in ebook (PDF) format and Paperback (hardcopy) format.

The partial response signaling model, illustrated in Figure 2, is expressed as a cascaded combination of a tapped delay line filter with tap coefficients set to and a filter with frequency response . The filter forces the desired sample values. On the other hand, the filter bandlimits the system response and at the same time it preserves the sample values from the filter . The choice of filter coefficients for the filter and the different choices for for satisfying Nyquist first criterion, result in different impulse response , but renders identical sample values in Figure 2 [1].

Figure 2: A generic partial response (PR) signaling model

To have a system with minimum possible bandwidth, the filter is chosen as

The inverse Fourier transform of results in a sinc pulse. The corresponding overall impulse response of the system is given by

If the bandwidth can be relaxed, other ISI free pulse-shapers like raised cosine can be considered for the filter.

Given the nature of real world channels, it is not always desirable to satisfy Nyquist’s first criterion. For example, the channel in magnetic recording, exhibits spectral null at certain frequencies and therefore it defines the channel’s upper frequency limit. In such cases, it is very difficult to satisfy Nyquist first criterion. An alternative viable solution is to allow a controlled amount of ISI between the adjacent samples at the output of the equivalent filter shown in Figure 2. This deliberate injection of controlled amount of ISI is called partial response (PR) signaling or correlative coding.

Partial Response Signaling Schemes

Several classes of PR signaling schemes and their corresponding transfer functions represented as (where is the delay operator) are shown in Table 1. The unit delay is equal to a delay of 1 symbol duration () in a continuous time system.

Rate this article: Note: There is a rating embedded within this post, please visit this post to rate it.

References

[1] Peter Kabal and Subbarayan Pasupathy, Partial-response signaling, IEEE Transactions on Communications, Vol. 23, No. 9, pp. 921-934, September 1975.↗

Topics in this chapter

Pulse Shaping, Matched Filtering and Partial Response Signaling
● Introduction
● Nyquist Criterion for zero ISI
● Discrete-time model for a system with pulse shaping and matched filtering
 □ Rectangular pulse shaping
 □ Sinc pulse shaping
 □ Raised-cosine pulse shaping
 □ Square-root raised-cosine pulse shaping
● Eye Diagram
● Implementing a Matched Filter system with SRRC filtering
 □ Plotting the eye diagram
 □ Performance simulation
● Partial Response Signaling Models
 □ Impulse response and frequency response of PR signaling schemes
● Precoding
 □ Implementing a modulo-M precoder
 □ Simulation and results

Books by the author


Wireless Communication Systems in Matlab
Second Edition(PDF)

Note: There is a rating embedded within this post, please visit this post to rate it.
Checkout Added to cart

Digital Modulations using Python
(PDF ebook)

Note: There is a rating embedded within this post, please visit this post to rate it.
Checkout Added to cart

Digital Modulations using Matlab
(PDF ebook)

Note: There is a rating embedded within this post, please visit this post to rate it.
Checkout Added to cart
Hand-picked Best books on Communication Engineering
Best books on Signal Processing

Construct eye diagram from stored signal samples

Eye diagram is a powerful tool to analyze the overall quality of a communication link. It reveals important characteristics of a communication link, that includes timing sensitivity, noise margin, inter-symbol interference (ISI) and zero-crossing jitter. It also shows the optimum sampling time for the receiver, which indicates when to sample the incoming signal for converting it to a symbol stream. It is more useful to plot the eye diagram at the receiver, where it gives visual cues for the engineers to check the signal integrity and to uncover problems in earlier stages of the design process.

Application of eye diagram

For each symbol received through a noisy channel, the receiver has to make the best estimate of what was transmitted. Eventually, this boils down to finding out the optimal decision time for each symbol (through timing recovery circuits) after the signal is processed through the equalizer and the matched filter.

In an eye diagram, each period of the waveform is repeated and overlaid on top of each other, forming an eye like pattern. It is usually visualized at the point just prior to the decisions. It reveals the ability of the receiver to distinguish between signal levels, in the presence of distortions like timing jitters (due to imperfect recovered clocks), noise level in the received signal prior to decision point, etc..,

An ideal eye diagram will show a wider eye that has a lot of margin in both horizontal and vertical direction that allows for lowest possible error rate in the receiver decisions. Figure 1, depicts the eye diagram for 2-PAM modulated square-root raised cosine (β=1) pulse shaped symbols sent through an AWGN channel having EbN0=50 dB (almost no noise condition).

Figure 1: Ideal eye diagram shown for two symbol durations for 2-PAM modulation shaped using square root raised cosine filters.

A narrower eye implies increased sensitivity to noise, since presence of more noise would cause erroneous symbol decisions. In essence, erroneous symbol decisions could be caused by timing jitters (measured in the horizontal direction) or the amplitude variation (measured in the vertical direction) or intersymbol interference (which affects the signal in both directions). Figure 2, depicts the eye diagram for 2-PAM modulated symbols sent through an AWGN channel having EbN0=20 dB (signal to noise ratio).

Figure 2: Eye diagram shown for 2-PAM modulated pulse shaped symbols corrupted with AWGN noise (EbN0=20 dB)

This article is part of the book
Wireless Communication Systems in Matlab (second edition), ISBN: 979-8648350779 available in ebook (PDF) format and Paperback (hardcopy) format.

Construction of eye diagrams from signals represented in computer memory.

To construct an eye diagram, the signal is divided into equal sections. The number of samples in each section should be proportional to , where is the symbol period (which is related to the oversampling factor by equation (1).

The factor denotes the oversampling factor or upsampling ratio which is given as the ratio of symbol period () and the sampling period () or equivalently, the ratio of sampling rate and the symbol rate

When all such sections are plotted in an overlapping manner, it produces the eye diagram. This is implemented in the following Matlab function. The sample usage of the function is given in the next section of this chapter and the sample outputs are available in the following Figure.

Program 1: plotEyeDiagram.m: Function for plotting eye diagram (kindly refer the book “Wireless Communication Systems using Matlab”)

function [eyeVals]=plotEyeDiagram(x,L,nSamples,offset,nTraces)
%Function to plot eye diagram
%x - input vector representing the signal
%L - oversampling factor (for calculating x-axis in plot)
%nSamples - number of samples per trace - preferably set to integral
% multiple of oversampling factor L(number of bits per symbol)
%offset - initial offset in the data from where to begin plotting
%nTraces - number of traces to plot
%If the signal processing toolbox is not available, put M=1
% and convert the line that says y=interp(x,M) to y=x

.....
Refer the book Wireless Communication systems using Matlab
.....
end

Rate this article: Note: There is a rating embedded within this post, please visit this post to rate it.

Further reading

[1] Tektronix application note: Anatomy of an eye diagram.↗
[2] Anritsu application note: Understanding eye pattern measurements.↗

Books by the author


Wireless Communication Systems in Matlab
Second Edition(PDF)

Note: There is a rating embedded within this post, please visit this post to rate it.
Checkout Added to cart

Digital Modulations using Python
(PDF ebook)

Note: There is a rating embedded within this post, please visit this post to rate it.
Checkout Added to cart

Digital Modulations using Matlab
(PDF ebook)

Note: There is a rating embedded within this post, please visit this post to rate it.
Checkout Added to cart
Hand-picked Best books on Communication Engineering
Best books on Signal Processing

Topics in this chapter

Pulse Shaping, Matched Filtering and Partial Response Signaling
● Introduction
● Nyquist Criterion for zero ISI
● Discrete-time model for a system with pulse shaping and matched filtering
 □ Rectangular pulse shaping
 □ Sinc pulse shaping
 □ Raised-cosine pulse shaping
 □ Square-root raised-cosine pulse shaping
● Eye Diagram
● Implementing a Matched Filter system with SRRC filtering
 □ Plotting the eye diagram
 □ Performance simulation
● Partial Response Signaling Models
 □ Impulse response and frequency response of PR signaling schemes
● Precoding
 □ Implementing a modulo-M precoder
 □ Simulation and results

Square-root raised-cosine pulse shaping

Let’s learn the equations and the filter model for simulating square root raised cosine (SRRC) pulse shaping. Before proceeding, I urge you to read about basics of pulse shaping in this article.

Figure 1: Combined response of two SRRC filters and frequency domain view of a single SRRC pulse

Raised-cosine pulse shaping filter is generally employed at the transmitter. Let be the raised cosine filter’s frequency response. Assume that the channel’s amplitude response is flat, i.e, and the channel noise is white. Then, the combined response of the transmit filter and receiver filter in frequency domain is given as

If the receive filter is matched with the transmit filter, we have

Thus, the transmit and the receive filter take the form

with , where is a nominal delay that is required to ensure the practical realizability of the filters. In time domain, a matched filter at the receiver is the mirrored copy of the impulse response of the transmit pulse shaping filter and is delayed by some time . Thus the task of raised cosine filtering is equally split between the transmit and receive filters. This gives rise to square-root raised-cosine (SRRC) filters at the transmitter and receiver, whose equivalent impulse response is described as follows.

This article is part of the book
Wireless Communication Systems in Matlab (second edition), ISBN: 979-8648350779 available in ebook (PDF) format and Paperback (hardcopy) format.

The roll-of factor for the SRRC is denoted as to distinguish it from that of the RC filter. A simple evaluation of the equation (4) produces singularities (undefined points) at and . The value of the square root raised cosine pulse at these singularities can be obtained by applying L’Hostipital’s rule [1] and the values are

A function for generating SRRC pulse shape is given next. It is followed by a test code that plots the combined impulse response of transmit-receive SRRC filter combination and also plots the frequency domain view of a single SRRC pulse as shown in Figure 1

The combined impulse response matters, as we can identify that the combined response hits zero at symbol sampling instants. This indicates that the job of ISI cancellation is split between transmitter and receiver filters. Note that the combined impulse response of two SRRC filters is same as the impulse response of the RC filter.

Program 1: srrcFunction.m: Function for generating square-root raised-cosine pulse (click here)

Matlab code for Program 1 is available is available in the book Wireless Communication Systems in Matlab (click here).

Program 2: test_SRRCPulse.m: Square-root raised-cosine pulse characteristics

Tsym=1; %Symbol duration in seconds
L=10; % oversampling rate, each symbol contains L samples
Nsym = 80; %filter span in symbol durations
betas=[0 0.22 0.5 1];%root raised-cosine roll-off factors
Fs=L/Tsym;%sampling frequency
lineColors=['b','r','g','k','c']; i=1;legendString=cell(1,4);
for beta=betas %loop for various alpha values
	[srrcPulseAtTx,t]=srrcFunction(beta,L,Nsym); %SRRC Filter at Tx
	srrcPulseAtRx = srrcPulseAtTx;%Using the same filter at Rx
	%Combined response matters as it hits 0 at desired sampling instants
	combinedResponse = conv(srrcPulseAtTx,srrcPulseAtRx,'same');
	
	subplot(1,2,1); t=Tsym*t; %translate time base & normalize reponse
	plot(t,combinedResponse/max(combinedResponse),lineColors(i));
	hold on;
	
	%See Chapter 1 for the function 'freqDomainView'
	[vals,F]=freqDomainView(srrcPulseAtTx,Fs,'double');
	subplot(1,2,2);
	plot(F,abs(vals)/abs(vals(length(vals)/2+1)),lineColors(i));
	hold on;legendString{i}=strcat('\beta =',num2str(beta) );i=i+1;
end
subplot(1,2,1);
title('Combined response of SRRC filters'); legend(legendString);
subplot(1,2,2);
title('Frequency response (at Tx/Rx only)');legend(legendString);

References

Rate this article: Note: There is a rating embedded within this post, please visit this post to rate it.

Topics in this chapter

Pulse Shaping, Matched Filtering and Partial Response Signaling
● Introduction
● Nyquist Criterion for zero ISI
● Discrete-time model for a system with pulse shaping and matched filtering
 □ Rectangular pulse shaping
 □ Sinc pulse shaping
 □ Raised-cosine pulse shaping
 □ Square-root raised-cosine pulse shaping
● Eye Diagram
● Implementing a Matched Filter system with SRRC filtering
 □ Plotting the eye diagram
 □ Performance simulation
● Partial Response Signaling Models
 □ Impulse response and frequency response of PR signaling schemes
● Precoding
 □ Implementing a modulo-M precoder
 □ Simulation and results

Books by the author


Wireless Communication Systems in Matlab
Second Edition(PDF)

Note: There is a rating embedded within this post, please visit this post to rate it.
Checkout Added to cart

Digital Modulations using Python
(PDF ebook)

Note: There is a rating embedded within this post, please visit this post to rate it.
Checkout Added to cart

Digital Modulations using Matlab
(PDF ebook)

Note: There is a rating embedded within this post, please visit this post to rate it.
Checkout Added to cart
Hand-picked Best books on Communication Engineering
Best books on Signal Processing

Raised cosine pulse shaping

As mentioned earlier, the shortcomings of the sinc pulse can be addressed by making the transition band in the frequency domain less abrupt. The raised-cosine (RC) pulse comes with an adjustable transition band roll-off parameter , using which the transition band’s rate of decay can be controlled. The RC pulse shaping function is expressed in frequency domain as

Correspondingly, in time domain, the impulse response is given by

This article is part of the book Wireless Communication Systems in Matlab, ISBN: 978-1720114352 available in ebook (PDF) format (click here) and Paperback (hardcopy) format (click here).

A simple evaluation of the equation (2) produces singularities (undefined points) at and . The value of the raised-cosine pulse at these singularities can be obtained by applying L’Hospital’s rule [1] and the values are

Figure 1: Raised-cosine pulse and its manifestation in frequency domain

The following Matlab codes generate a raised cosine pulse for the given symbol duration and plot the time-domain view and the frequency response (shown in Figure 1). The RC pulse falls off at the rate of as , which is a significant improvement when compared to the decay rate of sinc pulse which is . It satisfies Nyquist criterion for zero ISI – the pulse hits zero crossings at desired sampling instants. By controlling , the transition band roll-off in the frequency domain can be made gradual.

Program 1: raisedCosineFunction.m: Function for generating raised-cosine pulse(click here)

Matlab code for Program 1 is available is available in the book Wireless Communication Systems in Matlab (click here).

Program 2: test_RCPulse.m: Raised-cosine pulses and their manifestation in frequency domain

Tsym=1; %Symbol duration in seconds
L=10; % oversampling rate, each symbol contains L samples
Nsym = 80; %filter span in symbol durations
alphas=[0 0.3 0.5 1];%RC roll-off factors - valid range 0 to 1
Fs=L/Tsym;%sampling frequency
lineColors=['b','r','g','k','c']; i=1;legendString=cell(1,4);

for alpha=alphas %loop for various alpha values
	[rcPulse,t]=raisedCosineFunction(alpha,L,Nsym); %RC Pulse
	
	subplot(1,2,1); t=Tsym*t; %translate time base for given duration
	plot(t,rcPulse,lineColors(i));hold on; %plot time domain view
	[vals,f]=freqDomainView(rcPulse,Fs,'double');%See Chapter 1
	
	subplot(1,2,2);
	plot(f,abs(vals)/abs(vals(length(vals)/2+1)),lineColors(i));
	hold on;legendString{i}=strcat('\alpha =',num2str(alpha) );i=i+1;
end
subplot(1,2,1);title('Raised Cosine pulse'); legend(legendString);
subplot(1,2,2);title('Frequency response');legend(legendString);

References

[1] Clay S. Turner, Raised cosine and root raised cosine formulae, Wireless Systems Engineering, Inc, May 29, 2007.

Rate this post: Note: There is a rating embedded within this post, please visit this post to rate it.

Books by the author


Wireless Communication Systems in Matlab
Second Edition(PDF)

Note: There is a rating embedded within this post, please visit this post to rate it.
Checkout Added to cart

Digital Modulations using Python
(PDF ebook)

Note: There is a rating embedded within this post, please visit this post to rate it.
Checkout Added to cart

Digital Modulations using Matlab
(PDF ebook)

Note: There is a rating embedded within this post, please visit this post to rate it.
Checkout Added to cart
Hand-picked Best books on Communication Engineering
Best books on Signal Processing

Topics in this chapter

Pulse Shaping, Matched Filtering and Partial Response Signaling
● Introduction
● Nyquist Criterion for zero ISI
● Discrete-time model for a system with pulse shaping and matched filtering
 □ Rectangular pulse shaping
 □ Sinc pulse shaping
 □ Raised-cosine pulse shaping
 □ Square-root raised-cosine pulse shaping
● Eye Diagram
● Implementing a Matched Filter system with SRRC filtering
 □ Plotting the eye diagram
 □ Performance simulation
● Partial Response Signaling Models
 □ Impulse response and frequency response of PR signaling schemes
● Precoding
 □ Implementing a modulo-M precoder
 □ Simulation and results

Discrete-time communication system model

Key focus: Baseband communication system and its equivalent DSP implementation (discrete time model) with a pulse shaping & matched filter is briefly introduced.

If a train of pulses representing an information sequence need to be sent across a band-limited dispersive channel, the bandwidth of the channel should be large enough to accommodate the entire spectrum of the signal that is being sent. If we try to stuff the signal spectrum without proper pulse shaping into a band-limited channel, the spectrum of the received signal at the receiver will be truncated by the band-limiting nature of the channel. In time-domain, the energy of one pulse may spill to the time slot allocated for one or more adjacent pulses, leading to Inter-Symbol Interference (ISI) and therefore a source of error in the receiver.

ISI can be minimized by optimal signal design and the detection of a signal with known pulse shape that is buried in noise is a well-studied problem in communication. At the receiver, optimal signal detection is performed by a matched filter whose impulse response is matched to the impulse response of the pulse shaping filter employed at the transmitter.

This article is part of the book
Wireless Communication Systems in Matlab (second edition), ISBN: 979-8648350779 available in ebook (PDF) format and Paperback (hardcopy) format.

A typical baseband communication system and its equivalent DSP implementation (discrete time model) with a matched filter is shown in Figure 1. The interpolating filter at the transmitter is implemented in DSP as a chain of upsampler and a pulse shaping function. The upsampler inserts L-1 zeros between the successive incoming data samples and the pulse shaping filter fills in the zeros generated by the upsampler by using a pulse shaping function. On the other hand, the receiver contains a downsampler that keeps every Lth sample starting from a specified offset. The factor L denotes the oversampling factor or upsampling ratio which is given as the ratio of symbol period (Tsym) and the sampling period (Ts) or equivalently, the ratio of sampling rate Fs and the symbol rate Fsym as

Figure 1: A typical baseband communication system (top) and its equivalent DSP implementation (bottom)

The interpolating filter at the transmitter is implemented in DSP as a chain of upsampler and a pulse shaping function. The upsampler inserts zeros between the successive incoming data samples and the pulse shaping filter fills in the zeros generated by the upsampler by using a pulse shaping function. On the other hand, the receiver contains a downsampler that keeps every sample starting from a specified offset. The factor denotes the oversampling factor or upsampling ratio which is given as the ratio of symbol period () and the sampling period () or equivalently, the ratio of sampling rate and the symbol rate as

The implementation of impulse response of the most widely discussed pulsing shaping functions (filters) will follow in the next series of articles, followed by an example on a complete matched filter system with square-root raised-cosine pulse shaping.

Rate this article: Note: There is a rating embedded within this post, please visit this post to rate it.

Books by the author


Wireless Communication Systems in Matlab
Second Edition(PDF)

Note: There is a rating embedded within this post, please visit this post to rate it.
Checkout Added to cart

Digital Modulations using Python
(PDF ebook)

Note: There is a rating embedded within this post, please visit this post to rate it.
Checkout Added to cart

Digital Modulations using Matlab
(PDF ebook)

Note: There is a rating embedded within this post, please visit this post to rate it.
Checkout Added to cart
Hand-picked Best books on Communication Engineering
Best books on Signal Processing

Topics in this chapter

Pulse Shaping, Matched Filtering and Partial Response Signaling
● Introduction
● Nyquist Criterion for zero ISI
● Discrete-time model for a system with pulse shaping and matched filtering
 □ Rectangular pulse shaping
 □ Sinc pulse shaping
 □ Raised-cosine pulse shaping
 □ Square-root raised-cosine pulse shaping
● Eye Diagram
● Implementing a Matched Filter system with SRRC filtering
 □ Plotting the eye diagram
 □ Performance simulation
● Partial Response Signaling Models
 □ Impulse response and frequency response of PR signaling schemes
● Precoding
 □ Implementing a modulo-M precoder
 □ Simulation and results