Generating Basic signals – Rectangular Pulse and Power Spectral Density using FFT

Numerous texts are available to explain the basics of Discrete Fourier Transform and its very efficient implementation – Fast Fourier Transform (FFT).  Often we are confronted with the need to generate simple, standard signals (sine, cosineGaussian pulsesquare waveisolated rectangular pulse, exponential decay, chirp signal) for simulation purpose. I intend to show (in a series of articles) how these basic signals can be generated in Matlab and how to represent them in frequency domain using FFT.

This article is part of the book Digital Modulations using Matlab : Build Simulation Models from Scratch, ISBN: 978-1521493885 available in ebook (PDF) format (click here) and Paperback (hardcopy) format (click here)
Wireless Communication Systems in Matlab, ISBN: 978-1720114352 available in ebook (PDF) format (click here) and Paperback (hardcopy) format (click here).

Rectangular pulse: mathematical description

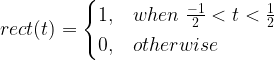
An isolated rectangular pulse of amplitude A and duration T is represented mathematically as

where

The Fourier transform of isolated rectangular pulse g(t) is

where, the sinc function is given by

Thus, the Fourier Transform pairs are

The Fourier Transform describes the spectral content of the signal at various frequencies. For a given signal g(t), the Fourier Transform is given by

where, the absolute value gives the magnitude of the frequency components (amplitude spectrum) and are their corresponding phase (phase spectrum) . For the rectangular pulse, the amplitude spectrum is given as

The amplitude spectrum peaks at f=0 with value equal to AT. The nulls of the spectrum occur at integral multiples of 1/T, i.e, ( )

Generating an isolated rectangular pulse in Matlab:

An isolated rectangular pulse of unit amplitude and width w (the factor T in equations above ) can be generated easily with the help of in-built function – rectpuls(t,w) command in Matlab. As an example, a unit amplitude rectangular pulse of duration is generated.

fs=500; %sampling frequency
T=0.2; %width of the rectangule pulse in seconds

t=-0.5:1/fs:0.5; %time base

x=rectpuls(t,T); %generating the square wave

plot(t,x,'k');
title(['Rectangular Pulse width=', num2str(T),'s']);
xlabel('Time(s)');
ylabel('Amplitude');
Rectangule Pulse how to plot FFT in Matlab

Amplitude spectrum using FFT:

Matlab’s FFT function is utilized for computing the Discrete Fourier Transform (DFT). The magnitude of FFT is plotted. From the following plot, it can be noted that the amplitude of the peak occurs at f=0 with peak value  . The nulls in the spectrum are located at  ().

L=length(x);
NFFT = 1024;
X = fftshift(fft(x,NFFT)); %FFT with FFTshift for both negative & positive frequencies
f = fs*(-NFFT/2:NFFT/2-1)/NFFT; %Frequency Vector

figure;
plot(f,abs(X)/(L),'r');
title('Magnitude of FFT');
xlabel('Frequency (Hz)')
ylabel('Magnitude |X(f)|');

Power spectral density (PSD) using FFT:

The distribution of power among various frequency components is plotted next. The first plot shows the double-side Power Spectral Density which includes both positive and negative frequency axis. The second plot describes the PSD only for positive frequency axis (as the response is just the mirror image of negative frequency axis).

figure;
Pxx=X.*conj(X)/(L*L); %computing power with proper scaling
plot(f,10*log10(Pxx),'r');
title('Double Sided - Power Spectral Density');
xlabel('Frequency (Hz)')
ylabel('Power Spectral Density- P_{xx} dB/Hz');
X = fft(x,NFFT);
X = X(1:NFFT/2+1);%Throw the samples after NFFT/2 for single sided plot
Pxx=X.*conj(X)/(L*L);
f = fs*(0:NFFT/2)/NFFT; %Frequency Vector
plot(f,10*log10(Pxx),'r');
title('Single Sided - Power Spectral Density');
xlabel('Frequency (Hz)')
ylabel('Power Spectral Density- P_{xx} dB/Hz');

Magnitude and phase spectrum:

The phase spectrum of the rectangular pulse manifests as series of pulse trains bounded between 0 and , provided the rectangular pulse is symmetrically centered around sample zero. This is explained in the reference here and the demo below.

clearvars;
x = [ones(1,7) zeros(1,127-13) ones(1,6)];
subplot(3,1,1); plot(x,'k');
title('Rectangular Pulse'); xlabel('Sample#'); ylabel('Amplitude');

NFFT = 127;
X = fftshift(fft(x,NFFT)); %FFT with FFTshift for both negative & positive frequencies
f = (-NFFT/2:NFFT/2-1)/NFFT; %Frequency Vector

subplot(3,1,2); plot(f,abs(X),'r');
title('Magnitude Spectrum'); xlabel('Frequency (Hz)'); ylabel('|X(f)|');

subplot(3,1,3); plot(f,atan2(imag(X),real(X)),'r');
title('Phase Spectrum'); xlabel('Frequency (Hz)'); ylabel('\angle X(f)');

Rate this article: Note: There is a rating embedded within this post, please visit this post to rate it.

Topics in this chapter

Essentials of Signal Processing
● Generating standard test signals
 □ Sinusoidal signals
 □ Square wave
 □ Rectangular pulse
 □ Gaussian pulse
 □ Chirp signal
Interpreting FFT results - complex DFT, frequency bins and FFTShift
 □ Real and complex DFT
 □ Fast Fourier Transform (FFT)
 □ Interpreting the FFT results
 □ FFTShift
 □ IFFTShift
Obtaining magnitude and phase information from FFT
 □ Discrete-time domain representation
 □ Representing the signal in frequency domain using FFT
 □ Reconstructing the time domain signal from the frequency domain samples
● Power spectral density
Power and energy of a signal
 □ Energy of a signal
 □ Power of a signal
 □ Classification of signals
 □ Computation of power of a signal - simulation and verification
Polynomials, convolution and Toeplitz matrices
 □ Polynomial functions
 □ Representing single variable polynomial functions
 □ Multiplication of polynomials and linear convolution
 □ Toeplitz matrix and convolution
Methods to compute convolution
 □ Method 1: Brute-force method
 □ Method 2: Using Toeplitz matrix
 □ Method 3: Using FFT to compute convolution
 □ Miscellaneous methods
Analytic signal and its applications
 □ Analytic signal and Fourier transform
 □ Extracting instantaneous amplitude, phase, frequency
 □ Phase demodulation using Hilbert transform
Choosing a filter : FIR or IIR : understanding the design perspective
 □ Design specification
 □ General considerations in design

Books by the author


Wireless Communication Systems in Matlab
Second Edition(PDF)

(172 votes, average: 3.66 out of 5)

Checkout Added to cart

Digital Modulations using Python
(PDF ebook)

(127 votes, average: 3.58 out of 5)

Checkout Added to cart

Digital Modulations using Matlab
(PDF ebook)

(134 votes, average: 3.63 out of 5)

Checkout Added to cart
Hand-picked Best books on Communication Engineering
Best books on Signal Processing

Generating Basic signals – Square Wave and Power Spectral Density using FFT

Note: There is a rating embedded within this post, please visit this post to rate it.

Numerous texts are available to explain the basics of Discrete Fourier Transform and its very efficient implementation – Fast Fourier Transform (FFT).  Often we are confronted with the need to generate simple, standard signals (sine, cosineGaussian pulsesquarewaveisolated rectangular pulse, exponential decay, chirp signal) for simulation purpose. I intend to show (in a series of articles) how these basic signals can be generated in Matlab and how to represent them in frequency domain using FFT.

This article is part of the book Digital Modulations using Matlab : Build Simulation Models from Scratch, ISBN: 978-1521493885 available in ebook (PDF) format (click here) and Paperback (hardcopy) format (click here)
Wireless Communication Systems in Matlab, ISBN: 978-1720114352 available in ebook (PDF) format (click here) and Paperback (hardcopy) format (click here).

Significance of Square Waves

The most logical way of transmitting information across a communication channel is through a stream of square pulse – a distinct pulse for ‘0‘ and another for ‘1‘. Digital signals are graphically represented as square waves with certain symbol/bit period. Square waves are also used universally in switching circuits, as clock signals synchronizing various blocks of digital circuits, as reference clock for a given system domain and so on.

Square wave manifests itself as a wide range of harmonics in frequency domain and therefore can cause electromagnetic interference. Square waves are periodic and contain odd harmonics when expanded as Fourier Series (where as signals like saw-tooth and other real word signals contain harmonics at all integer frequencies). Since a square wave literally expands to infinite number of odd harmonic terms in frequency domain, approximation of square wave is another area of interest. The number of terms of its Fourier Series expansion, taken for approximating the square wave is often seen as Gibbs Phenomenon, which manifests as ringing effect at the corners of the square wave in time domain (visual explanation here).

True Square waves are a special class of rectangular waves with 50% duty cycle. Varying the duty cycle of a rectangular wave leads to pulse width modulation, where the information is conveyed by changing the duty-cycle of each transmitted rectangular wave.

How to generate a square wave in Matlab

If you know the trick of generating a sine wave in Matlab, the task is pretty much simple. Square wave is generated using “square” function in Matlab. The command sytax – square(t,dutyCycle) – generates a square wave with period for the given time base. The command behaves similar to “sin” command (used for generating sine waves), but in this case it generates a square wave instead of a sine wave. The argument – dutyCycle is optional and it defines the desired duty cycle of the square wave. By default (when the dutyCycle argument is not supplied) the square wave is generated with (50%) duty cycle.

f=10; %frequency of sine wave in Hz
overSampRate=30; %oversampling rate
fs=overSampRate*f; %sampling frequency
duty_cycle=50; % Square wave with 50% Duty cycle (default)
nCyl = 5; %to generate five cycles of sine wave

t=0:1/fs:nCyl*1/f; %time base

x=square(2*pi*f*t,duty_cycle); %generating the square wave

plot(t,x,'k');
title(['Square Wave f=', num2str(f), 'Hz']);
xlabel('Time(s)');
ylabel('Amplitude');

Power Spectral Density using FFT

Let’s check out how the generated square wave will look in frequency domain. The Fast Fourier Transform (FFT) is utilized here. As discussed in the article here, there are numerous ways to plot the response of FFT. Single Sided power spectral density is plotted first, followed by the Double-sided power spectral density.

Single Sided Power Spectral Density

X = fft(x,NFFT);
X = X(1:NFFT/2+1);%Throw the samples after NFFT/2 for single sided plot
Pxx=X.*conj(X)/(NFFT*L);
f = fs*(0:NFFT/2)/NFFT; %Frequency Vector

plot(f,10*log10(Pxx),'r');
title('Single Sided Power Spectral Density');
xlabel('Frequency (Hz)')
ylabel('Power Spectral Density- P_{xx} dB/Hz');
ylim([-45 -5])

Double Sided Power Spectral Density

L=length(x);
NFFT = 1024;
X = fftshift(fft(x,NFFT));
Pxx=X.*conj(X)/(NFFT*L); %computing power with proper scaling
f = fs*(-NFFT/2:NFFT/2-1)/NFFT; %Frequency Vector

plot(f,10*log10(Pxx),'r');
title('Double Sided Power Spectral Density');
xlabel('Frequency (Hz)')
ylabel('Power Spectral Density- P_{xx} dB/Hz');
Note: There is a rating embedded within this post, please visit this post to rate it.

Topics in this chapter

Essentials of Signal Processing
● Generating standard test signals
 □ Sinusoidal signals
 □ Square wave
 □ Rectangular pulse
 □ Gaussian pulse
 □ Chirp signal
Interpreting FFT results - complex DFT, frequency bins and FFTShift
 □ Real and complex DFT
 □ Fast Fourier Transform (FFT)
 □ Interpreting the FFT results
 □ FFTShift
 □ IFFTShift
Obtaining magnitude and phase information from FFT
 □ Discrete-time domain representation
 □ Representing the signal in frequency domain using FFT
 □ Reconstructing the time domain signal from the frequency domain samples
● Power spectral density
Power and energy of a signal
 □ Energy of a signal
 □ Power of a signal
 □ Classification of signals
 □ Computation of power of a signal - simulation and verification
Polynomials, convolution and Toeplitz matrices
 □ Polynomial functions
 □ Representing single variable polynomial functions
 □ Multiplication of polynomials and linear convolution
 □ Toeplitz matrix and convolution
Methods to compute convolution
 □ Method 1: Brute-force method
 □ Method 2: Using Toeplitz matrix
 □ Method 3: Using FFT to compute convolution
 □ Miscellaneous methods
Analytic signal and its applications
 □ Analytic signal and Fourier transform
 □ Extracting instantaneous amplitude, phase, frequency
 □ Phase demodulation using Hilbert transform
Choosing a filter : FIR or IIR : understanding the design perspective
 □ Design specification
 □ General considerations in design

Books by the author


Wireless Communication Systems in Matlab
Second Edition(PDF)

Note: There is a rating embedded within this post, please visit this post to rate it.
Checkout Added to cart

Digital Modulations using Python
(PDF ebook)

Note: There is a rating embedded within this post, please visit this post to rate it.
Checkout Added to cart

Digital Modulations using Matlab
(PDF ebook)

Note: There is a rating embedded within this post, please visit this post to rate it.
Checkout Added to cart
Hand-picked Best books on Communication Engineering
Best books on Signal Processing

Understanding Gibbs Phenomenon in signal processing

Introduction

Gibbs phenomenon is a phenomenon that occurs in signal processing and Fourier analysis when approximating a discontinuous function using a series of Fourier coefficients. Specifically, it is the observation that the overshoots near the discontinuities of the approximated function do not decrease with increasing numbers of Fourier coefficients used in the approximation.

In other words, when a discontinuous function is approximated by its Fourier series, the resulting series will exhibit oscillations near the discontinuities that do not diminish as more terms are added to the series. This can lead to a “ringing” effect in the signal, where there are spurious oscillations near the discontinuity that can persist even when the number of Fourier coefficients used in the approximation is increased.

The Gibbs phenomenon is named after American physicist Josiah Willard Gibbs, who first described it in 1899. It is a fundamental limitation of the Fourier series approximation and can occur in many other areas of signal processing and analysis as well.

Gibbs phenomenon

Fourier transform represents signals in frequency domain as summation of unique combination of sinusoidal waves. Fourier transforms of various signals are shown in the Figure 1. Some of these signals, square wave and impulse, have abrupt discontinuities (sudden changes) in time domain. They also have infinite frequency content in the frequency domain.

Figure 1: Frequency response of various test signals

Therefore, abrupt discontinuities in the signals require infinite frequency content in frequency domain. As we know, in order to represent these signals in computer memory, we cannot dispense infinite memory (or infinite bandwidth when capturing/measurement) to hold those infinite frequency terms. Somewhere, the number of frequency terms has to be truncated. This truncation in frequency domain manifests are ringing artifacts in time domain and vice-versa. This is called Gibbs phenomenon.

Figure 2: Ringing artifact (Gibbs phenomenon) on a square wave when the number of frequency terms is truncated

These ringing artifacts result from trying to describe the given signal with less number of frequency terms than the ideal. In practical applications, the ringing artifacts can result from

● Truncation of frequency terms – For example, to represent a perfect square wave, an infinite number of frequency terms are required. Since we cannot have an instrument with infinite bandwidth, the measurement truncates the number of frequency terms, resulting in the ringing artifact.

● Shape of filters – The ringing artifacts resulting from filtering operation is related to the sharp transitions present in the shape of the filter impulse response.

FIR filters and Gibbs phenomenon

Owing to their many favorable properties, digital Finite Impulse Response (FIR) filters are extremely popular in many signal processing applications. FIR filters can be designed to exhibit linear phase response in passband, so that the filter does not cause delay distortion (or dispersion) where different frequency components undergo different delays.

The simplest FIR design technique is the Impulse Response Truncation, where an ideal impulse response of infinite duration is truncated to finite length and the samples are delayed to make it causal. This method comes with an undesirable effect due to Gibbs Phenomenon.

Ideal brick wall characteristics in frequency domain is desired for most of the filters. For example, a typical ideal low pass filter necessitates sharp transition between passband and stopband. Any discontinuity (abrupt transitions) in one domain requires infinite number of components in the other domain.

For example, a rectangular function with abrupt transition in frequency domain translates to a \(sinc(x)=sin(x)/x\) function of infinite duration in time domain. In practical filter design, the FIR filters are of finite length. Therefore, it is not possible to represent an ideal filter with abrupt discontinuities using finite number of taps and hence the \(sinc\) function in time domain should be truncated appropriately. This truncation of an infinite duration signal in time domain leads to a phenomenon called Gibbs phenomenon in frequency domain. Since some of the samples in time domain (equivalently harmonics in frequency domain) are not used in the reconstruction, it leads to oscillations and ringing effect in the other domain. This effect is called Gibbs phenomenon.

Similar effect can also be observed in the time domain if truncation is done in the frequency domain.

This effect due to abrupt discontinuities will exists no matter how large the number of samples  is made. The situation can be improved by using a smoothly tapering windows like Blackman, Hamming , Hanning , Keiser windows etc.,

Demonstration of Gibbs Phenomenon using Matlab:

In this demonstration, a sinc pulse in time domain is considered. Sinc pulse with infinite duration in time domain, manifests as perfect rectangular shape in frequency domain. In this demo, we truncate the sinc pulse in the time domain at various length and use FFT (Fast Fourier Transform) to visualize it frequency domain. As the duration of time domain samples increases, the ringing artifact become less pronounced and the shape approaches ideal brick wall filter response.

%Gibbs Phenomenon
clearvars; % clear all stored variables

Nsyms = 5:10:60; %filter spans in symbol duration

Tsym=1; %Symbol duration
L=16; %oversampling rate, each symbol contains L samples
Fs=L/Tsym; %sampling frequency

for Nsym=Nsyms,
    [p,t]=sincFunction(L,Nsym); %Sinc Pulse

    subplot(1,2,1);
    plot(t*Tsym,p,'LineWidth',1.5);axis tight;
    ylim([-0.3,1.1]);
    title('Sinc pulse');xlabel('Time (s)');ylabel('Amplitude');
    
    [fftVals,freqVals]=freqDomainView(p,Fs,'double'); %See Chapter 1
    subplot(1,2,2);
    plot(freqVals,abs(fftVals)/abs(fftVals(length(fftVals)/2+1)),'LineWidth',1.5);
    xlim([-2 2]); ylim([0,1.1]);
    title('Frequency response of Sinc (FFT)');
    xlabel('Normalized Frequency (Hz)');ylabel('Magnitude');
    pause;% wait for user input to continue
end

Simulation Results:

Figure 3: Sinc pulse constructed with Nsym = 5 (filter span in symbols) and L =16 (samples/symbol)
Figure 4: Sinc pulse constructed with Nsym = 15 (filter span in symbols) and L =16 (samples/symbol)
Figure 5: Sinc pulse constructed with Nsym = 35 (filter span in symbols) and L =16 (samples/symbol)

I have also discussed with examples, Gibbs phenomenon applied to truncation of Fourier series coefficients. You can read about it here.

Similar articles

[1] Understanding Fourier Series
[2] Introduction to digital filter design
[3] Design FIR filter to reject unwanted frequencies
[4] FIR or IIR ? Understand the design perspective
[5] How to Interpret FFT results – complex DFT, frequency bins and FFTShift
[6] How to interpret FFT results – obtaining magnitude and phase information
[7] Analytic signal, Hilbert Transform and FFT
[8] FFT and spectral leakage
[9] Moving average filter in Python and Matlab

Books by the author


Wireless Communication Systems in Matlab
Second Edition(PDF)

Note: There is a rating embedded within this post, please visit this post to rate it.
Checkout Added to cart

Digital Modulations using Python
(PDF ebook)

Note: There is a rating embedded within this post, please visit this post to rate it.
Checkout Added to cart

Digital Modulations using Matlab
(PDF ebook)

Note: There is a rating embedded within this post, please visit this post to rate it.
Checkout Added to cart
Hand-picked Best books on Communication Engineering
Best books on Signal Processing