Often the most basic step in signal processing of audio files, one would like to visualize an audio sample file as time-series data.
Audio sounds can be thought of as an one-dimensional vector that stores numerical values corresponding to each sample. The time-series plot is a two dimensional plot of those sample values as a function of time.
Python’s SciPy library comes with a collection of modules for reading from and writing data to a variety of file formats. For example, the scipy.io.wavfile module can be used to read from and write to a .wav format file.
For the following demonstration, sample audio files given in this URL are used for the visualization task.
The read function in the scipy.io.wavefile module can be utilized to open the selected wav file. It returns the sample rate and the data samples.
>>> from scipy.io.wavfile import read #import the required function from the module

>>> samplerate, data = read('CantinaBand3.wav')

>>> samplerate #echo samplerate
22050

>>> data #echo data -> note that the data is a single dimensional array
array([   3,    7,    0, ...,  -12, -427, -227], dtype=int16)
Compute the duration and the time vector of the audio sample from the sample rate
>>> duration = len(data)/samplerate
>>> time = np.arange(0,duration,1/samplerate) #time vector
Plot the time-series data using matplotlib package
>>> import matplotlib.pyplot as plt
>>> import numpy as np
>>> plt.plot(time,data)
>>> plt.xlabel('Time [s]')
>>> plt.ylabel('Amplitude')
>>> plt.title('CantinaBand3.wav')
>>> plt.show()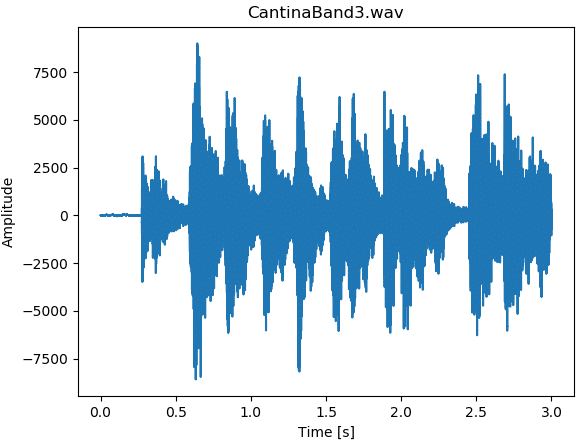
Rate this article: [ratings]
can you explain why do you have 1/samplerate in time?