
Articles in this series
- Phased array antenna — an introduction
- Electronic scanning arrays (this article)
- Grating lobes in electronic scanning
- Array pattern multiplication
Introduction
Suppose the antenna cannot move — a radar on a mast, a panel on a tower — but you still need the beam to point somewhere else. That is electronic scanning: leave the aperture where it is, and change only the phases (or time delays) at the elements.
Motive
The formula you want is \(\psi = kd\sin\theta_0\). We will not treat it as something to memorise. Start from the path difference between neighbouring elements, convert that delay into phase, and the steering condition appears by itself. After that, a short simulation checks that the main beam really sits at \(\theta_0\).
Technical development
Path delay between neighbours
Place elements along a line with spacing \(d\). A plane wave from angle \(\theta\) (measured from broadside) has a path difference \(d\sin\theta\) between adjacent elements, and therefore a phase
\[\phi = k d \sin\theta = \frac{2\pi}{\lambda} d \sin\theta.\]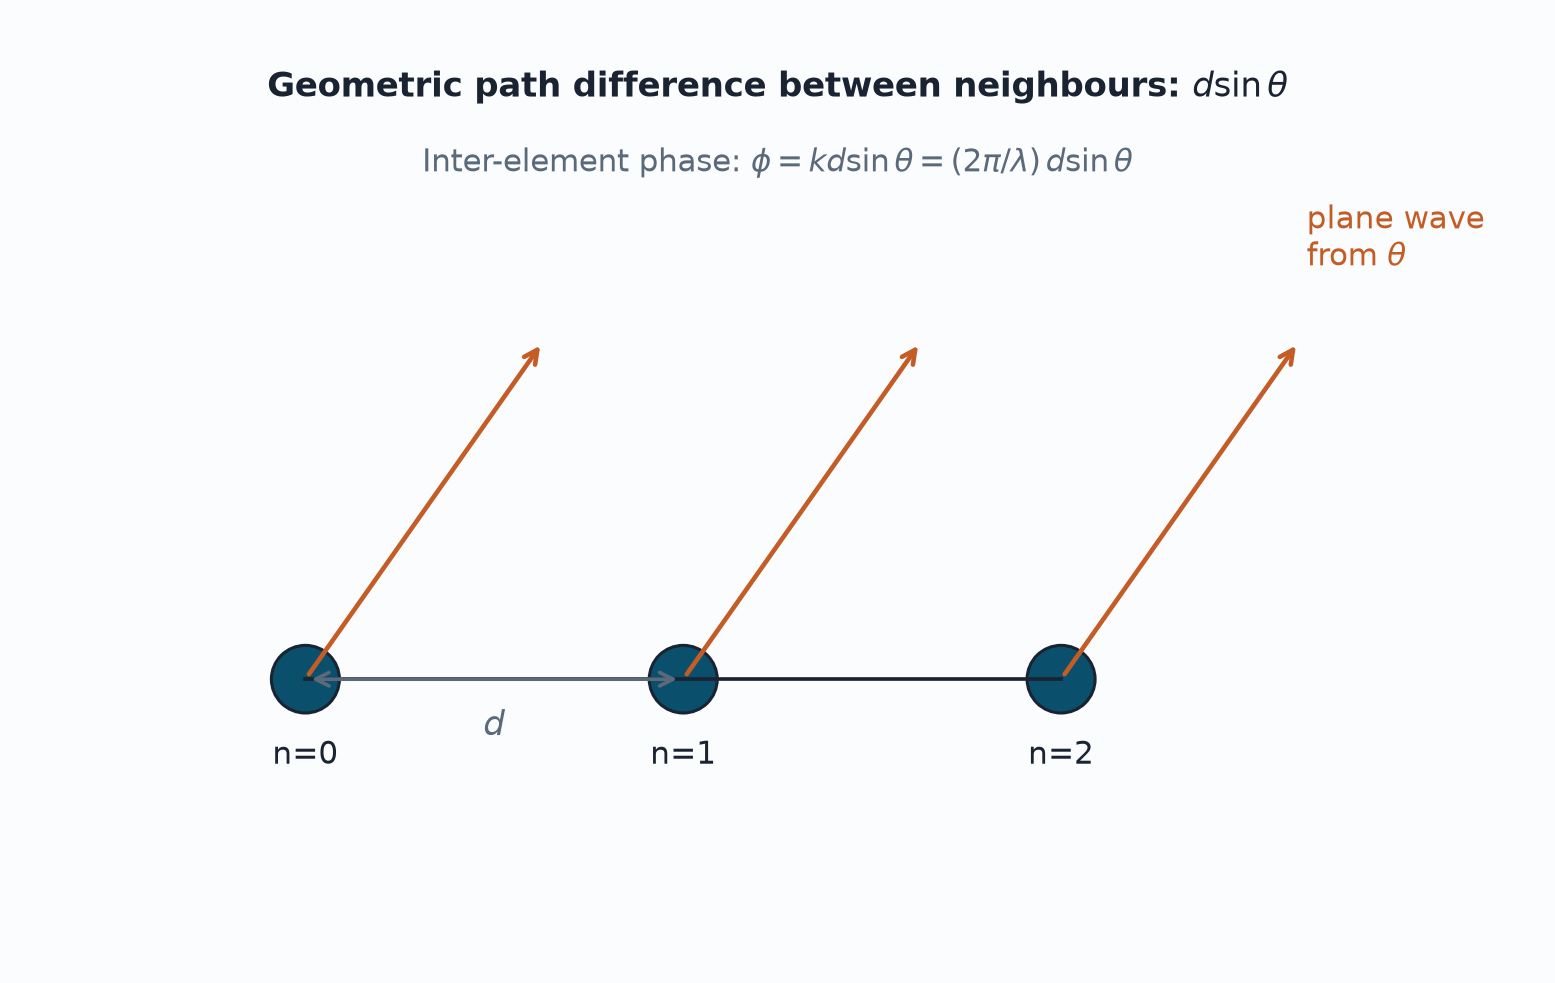
Array factor and steering
With equal amplitudes the far-field sum is a geometric series. Write \(u=\sin\theta\) and steer to \(u_0=\sin\theta_0\) with a progressive feed phase:
\[A(u;u_0)=\sum_{n=0}^{N-1} e^{j n k d (u-u_0)} = e^{j\alpha}\frac{\sin\!\bigl(Nkd(u-u_0)/2\bigr)}{\sin\!\bigl(kd(u-u_0)/2\bigr)}.\]The magnitude peaks when \(u=u_0\). That is electronic scan. For a three-element example the resultant is proportional to \(1+2\cos\delta\) with \(\delta=kd(u-u_0)\), and it is largest at \(\delta=0\)—not at \(\cos\delta=0\).
How this achieves the motive
The progressive phase simply cancels the path delay at the desired angle. Figure 1 draws the geometry; once you have that picture, \(\psi_n = -n kd\sin\theta_0\) is just the phase you must apply at element \(n\).
Sample simulation
import numpy as np
import matplotlib.pyplot as plt

def array_factor(u, N, d_over_lambda, u0=0.0, weights=None):
    """Normalized |AF(u)|^2, u=sin(theta)."""
    if weights is None:
        weights = np.ones(N)
    weights = np.asarray(weights, dtype=float)
    weights = weights / np.max(np.abs(weights))
    kdl = 2 * np.pi * d_over_lambda
    af = np.zeros_like(u, dtype=complex)
    for n in range(N):
        af += weights[n] * np.exp(1j * n * kdl * (u - u0))
    g = np.abs(af) ** 2
    return g / np.max(g)

def db(g, floor=-60.0):
    return 10 * np.log10(np.maximum(g, 10 ** (floor / 10)))

u = np.linspace(-1, 1, 2001)
N, d = 16, 0.5
plt.figure(figsize=(8, 4.5))
for u0, lab in ((0.0, "theta0=0"), (0.5, "theta0=+30 deg"), (-0.5, "theta0=-30 deg")):
    plt.plot(u, db(array_factor(u, N, d, u0=u0)), label=lab)
plt.xlabel("u"); plt.ylabel("Normalized |AF|^2 (dB)")
plt.ylim(-50, 2); plt.grid(True); plt.legend(); plt.show()
# Closed form vs direct sum (broadside)
theta = np.linspace(-np.pi/2, np.pi/2, 2001)
N, d_l = 8, 0.5
psi = 2*np.pi*d_l*np.sin(theta)
with np.errstate(divide="ignore", invalid="ignore"):
    af_c = np.sin(N*psi/2)/(N*np.sin(psi/2))
af_c = np.nan_to_num(af_c, nan=1.0)
g_c = np.abs(af_c)**2
g_d = array_factor(np.sin(theta), N, d_l, u0=0.0)
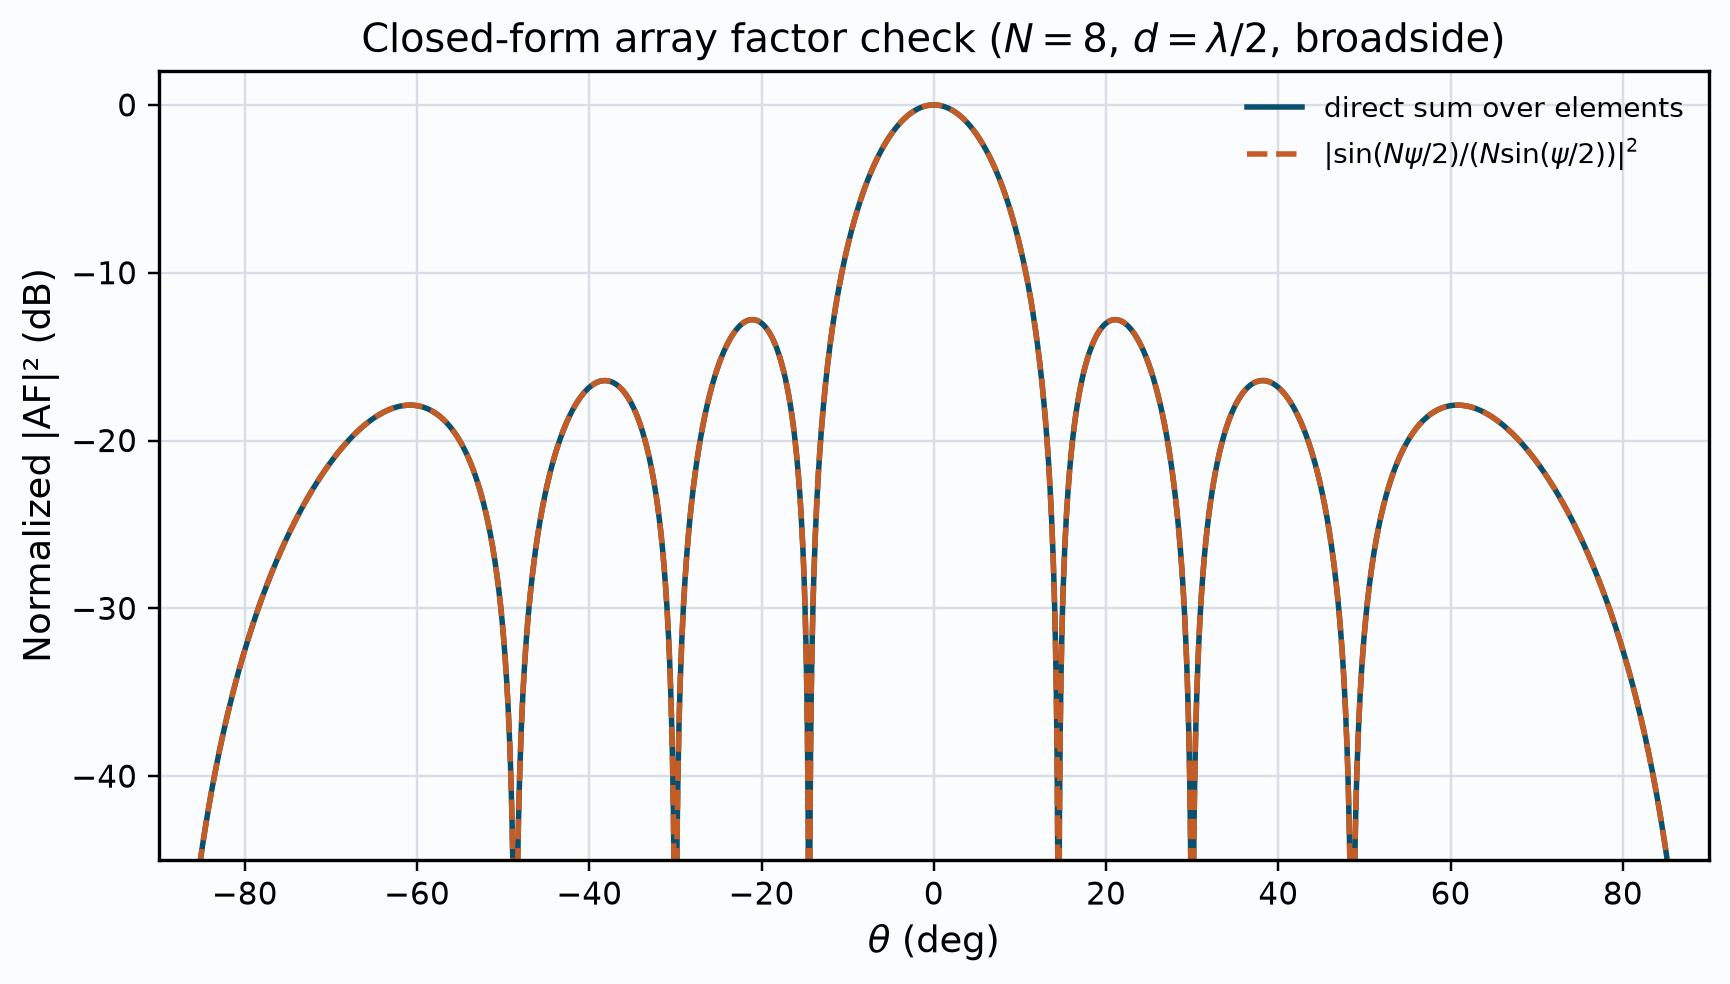
# g_c and g_d overlay on a dB plot — see Figure 3
Sample results
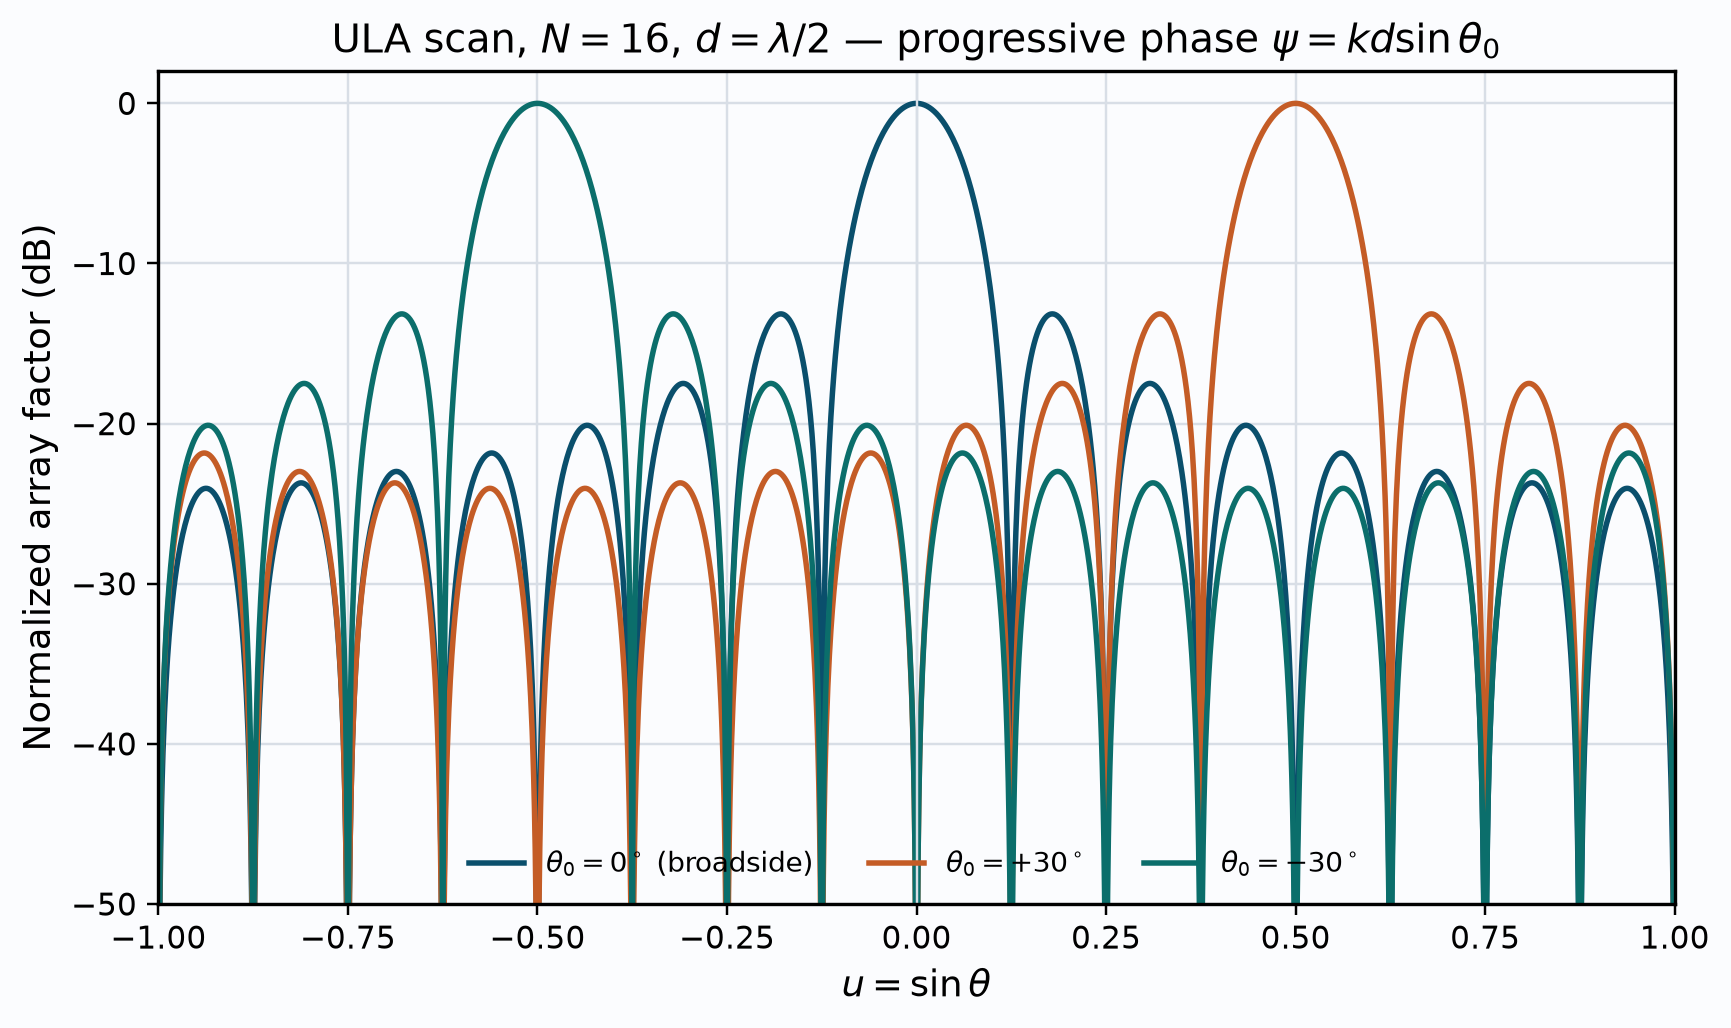
In Figure 2 the main beam sits at \(u=0,\pm 0.5\) as commanded. Absolute gain still falls roughly as \(\cos\theta_0\) off broadside; normalisation hides that scan loss. Figure 3 should show two curves lying on top of each other—a check that the closed form matches the direct sum.
Next topic
Space the elements farther than about \(\lambda/2\) and extra peaks appear in visible space. Those are grating lobes—spatial aliases of the periodic aperture.
References
[1] Balanis. [2] Mailloux.
Sir, Which is a good book to build intuition and mathematical rigor on array signal processing?