
MIMO — Capacity path
1. Intro → 2. Channel model → 3. SISO capacity → 4. Ergodic SISO → 5. MIMO capacity
Tools: Shannon calculator
Introduction
Shannon’s formula \(C=\log_2(1+\mathrm{SNR})\) shows up in every communications course. On a fading channel the SNR itself is random, so capacity becomes a random variable. What does that mean in practice? When do we average over fades, and when do we protect against the bad draws?
Motive
Suppose you send a codeword over a mobile link. If the codeword is long compared with the coherence time, it sees many fades and the quantity that matters is the average mutual information—ergodic capacity. If the codeword sits inside one fade (slow fading, short packets), the link is in outage whenever that fade’s mutual information falls below the chosen rate. Mix the two up and you design the wrong code.
Technical development
With receiver CSI and instantaneous power gain \(|h|^2\),
\[C(|h|^2)=\log_2\bigl(1+|h|^2\rho\bigr), \qquad \rho=\frac{P}{N_0}.\]On AWGN we set \(|h|=1\). On Rayleigh fading, \(|h|^2\sim\mathrm{Exp}(1)\) if \(h\sim\mathcal{CN}(0,1)\). Then:
- Ergodic capacity: \(C_{\mathrm{erg}}(\rho)=E[C(|h|^2)]\).
- \(\varepsilon\)-outage capacity: the largest \(R\) with \(P\bigl(C(|h|^2)<R\bigr)\le\varepsilon\).
How this achieves the motive
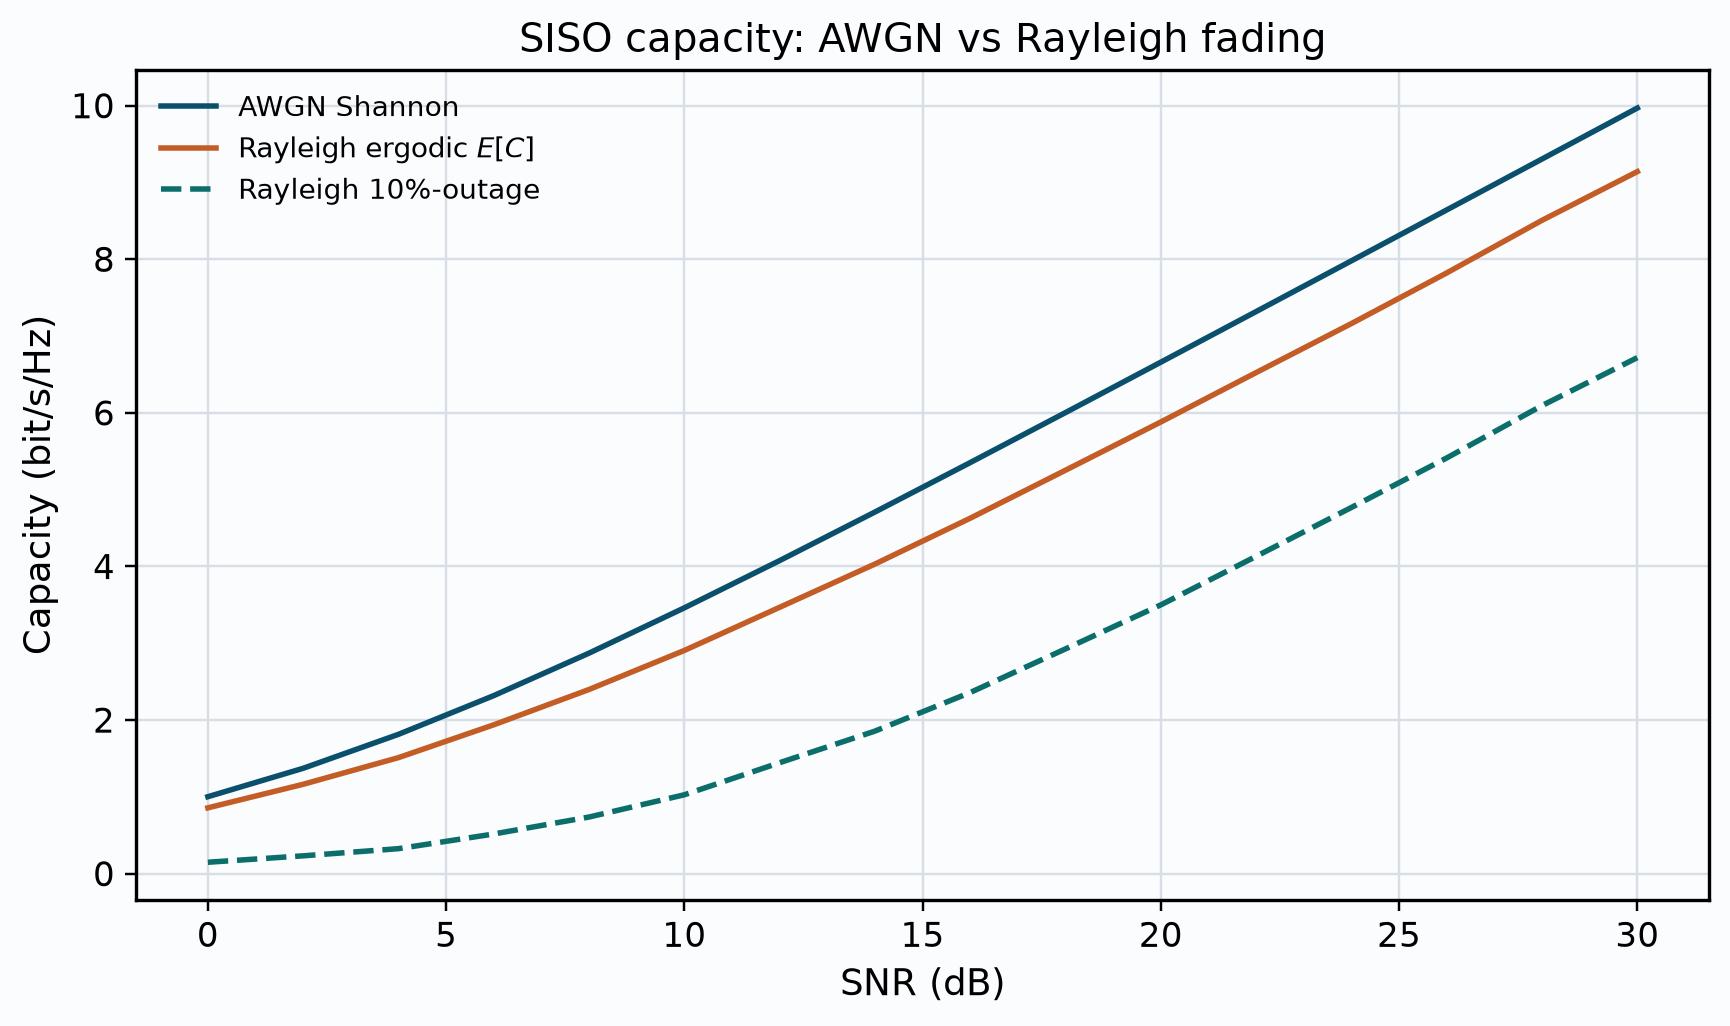
Figure 1 separates the two design worlds. The ergodic curve lies below AWGN—fading costs average rate—but still grows like \(\log\rho\) at high SNR. The 10%-outage curve lies lower still: if you insist that nine out of ten fades support your rate, you must back off. That is precisely the price of not coding across many fades.
Sample simulation
import numpy as np
import matplotlib.pyplot as plt

snr_db = np.arange(0, 31, 2)
awgn = np.log2(1 + 10 ** (snr_db / 10))
rng = np.random.default_rng(2)
erg, out10 = [], []
for s in snr_db:
    rho = 10 ** (s / 10)
    h2 = rng.exponential(1.0, size=20000)
    c = np.log2(1 + rho * h2)
    erg.append(c.mean())
    out10.append(np.percentile(c, 10))

plt.plot(snr_db, awgn, label="AWGN Shannon")
plt.plot(snr_db, erg, label="Rayleigh ergodic")
plt.plot(snr_db, out10, "--", label="10% outage")
plt.xlabel("SNR (dB)"); plt.ylabel("Capacity (bit/s/Hz)")
plt.grid(True); plt.legend(); plt.show()
Sample results
Your plot should overlay Figure 1. At 20 dB SNR the AWGN rate is about 6.7 bit/s/Hz; the Rayleigh ergodic value is a bit lower; the 10%-outage value is noticeably lower. Try changing the percentile to 1%: the outage curve drops again. That dial is the reliability target of a slow-fading link.
Next topic
The next article drills into the ergodic average alone—Monte Carlo versus the exponential-integral closed form—so you trust the numerical method before we generalise it to matrices and then to MIMO.
References
- A. Goldsmith, Wireless Communications, Cambridge University Press, Cambridge, UK, 2005. Chapter 4.
- D. Tse and P. Viswanath, Fundamentals of Wireless Communication, Cambridge University Press, Cambridge, UK, 2005. Chapter 5.
- M. K. Simon and M.-S. Alouini, Digital Communication over Fading Channels, 2nd ed., John Wiley & Sons, Hoboken, NJ, 2005.
Frequently asked questions
What is the difference between ergodic capacity and outage capacity? Ergodic capacity is the average mutual information when a codeword spans many independent fades. Outage capacity is the largest rate \(R\) such that the probability that a single fade’s mutual information falls below \(R\) stays under a target \(\varepsilon\). Long coded blocks favour the ergodic view; short packets in slow fading favour the outage view.
Why does Rayleigh fading reduce average rate relative to AWGN? Because \(\log_2(1+|h|^2\rho)\) is concave in the power gain, Jensen’s inequality places the average below the AWGN rate at the mean SNR. Deep fades pull the average down more than good fades push it up.
How is the 10% outage capacity read from a simulation? Draw many realisations of \(|h|^2\), compute instantaneous capacity for each, and take the 10th percentile of that empirical distribution. That rate is supported by at least 90% of the fades at the chosen SNR.
When should a link designer use outage capacity instead of ergodic capacity? When the codeword duration is comparable to or shorter than the coherence time, so the packet experiences essentially one channel draw. Then reliability is set by the outage probability at the chosen rate, not by a long-term average.
Sir,
please continue this discussion. it is extremely useful. I request you to extend it to space time codes, OFDM and CDMA.
Is ‘h’ a constant or a vector? How to define it while simulating this environment in MATLAB?
For fading channels, ‘h’ is a random variable of length L where the elements are usually drawn from complex space ‘C’. can be modeled as a vector in Matlab
h = randn(1,L) + 1i* randn(1,L)
Sorry another thing I wanted to ask; I’ve trying to implement outage capacity in MATLAB but so far my attempts are not good. Can you please help me here? I’m setting C=1, Pt = 1 and noise variance No. Like I know what is going on but I’m unable to simulate the capacity outage for each SNR.
Thanks
And also in what is |h|.^2? abs(h).^2 or h.*(conj(h))?
both are equivalent
In Probability density function of noise (i.e. eqn no.10) ” pi ” is missing in the denominator. Is it right or wrong ?
Mistake corrected. Thanks for spotting it.
Can you please give the proof for this derivation sir https://uploads.disquscdn.com/images/d06373c28b941e69b9f4c91c55287301680eb483adc127d1a523fc765f93a97f.png
anyone can give the proof for this ?
Dear sir,
Can you please elaborate how you have considered equation 10 ( PDF of complex Gaussian noise N)?