Key focus of this article: Understand the relationship between analytic signal, Hilbert transform and FFT. Hands-on demonstration using Python and Matlab.
Introduction
Fourier Transform of a real-valued signal is complex-symmetric. It implies that the content at negative frequencies are redundant with respect to the positive frequencies. In their works, Gabor [1]and Ville [2], aimed to create an analytic signal by removing redundant negative frequency content resulting from the Fourier transform. The analytic signal is complex-valued but its spectrum will be one-sided (only positive frequencies) that preserved the spectral content of the original real-valued signal. Using an analytic signal instead of the original real-valued signal, has proven to be useful in many signal processing applications. For example, in spectral analysis, use of analytic signal in-lieu of the original real-valued signal mitigates estimation biases and eliminates cross-term artifacts due to negative and positive frequency components [3].
Let be a real-valued non-bandlimited finite energy signal, for which we wish to construct a corresponding analytic signal . The Continuous Time Fourier Transform of is given by
Lets say the magnitude spectrum of is as shown in Figure 1(a). We note that the signal is a real-valued and its magnitude spectrum is symmetric and extends infinitely in the frequency domain.
Figure 1: (a) Spectrum of continuous signal x(t) and (b) spectrum of analytic signal z(t)
As mentioned in the introduction, an analytic signal can be formed by suppressing the negative frequency contents of the Fourier Transform of the real-valued signal. That is, in frequency domain, the spectral content of the analytic signal is given by
The corresponding spectrum of the resulting analytic signal is shown in Figure 1(b).
Since the spectrum of the analytic signal is one-sided, the analytic signal will be complex valued in the time domain, hence the analytic signal can be represented in terms of real and imaginary components as . Since the spectral content is preserved in an analytic signal, it turns out that the real part of the analytic signal in time domain is essentially the original real-valued signal itself . Then, what takes place of the imaginary part ? Who is the companion to x(t) that occupies the imaginary part in the resulting analytic signal ? Summarizing as equation,
It is interesting to note that Hilbert transform [4]can be used to find a companion function (imaginary part in the equation above) to a real-valued signal such that the real signal can be analytically extended from the real axis to the upper half of the complex plane . Denoting Hilbert transform as , the analytic signal is given by
From these discussion, we can see that an analytic signal for a real-valued signal , can be constructed using two approaches.
● Frequency domain approach: The one-sided spectrum of is formed from the two-sided spectrum of the real-valued signal by applying equation (2) ● Time domain approach: Using Hilbert transform approach given in equation (4)
One of the important property of an analytic signal is that its real and imaginary components are orthogonal
Discrete-time analytic signal
Since we are in digital era, we are more interested in discrete-time signal processing. Consider a continuous real-valued signal gets sampled at interval seconds and results in real-valued discrete samples , i.e, . The spectrum of the continuous signal is shown in Figure 2(a). The spectrum of that results from the process of periodic sampling is given in Figure 2(b) (Refer here more details on the process of sampling). The spectrum of discrete-time signal can be obtained by Discrete-Time Fourier Transform (DTFT).
Figure 2: (a) CTFT of continuous signal x(t), (b) Spectrum of x[n] resulted due to periodic sampling and (c) Periodic one-sided spectrum of analytical signal z[n]
At this point, we would like to construct a discrete-time analytic signal from the real-valued sampled signal . We wish the analytic signal is complex valued and should satisfy the following two desired properties
● The real part of the analytic signal should be same as the original real-valued signal. ● The real and imaginary part of the analytic signal should satisfy the following property of orthogonality
In Frequency domain approach for the continuous-time case, we saw that an analytic signal is constructed by suppressing the negative frequency components from the spectrum of the real signal. We cannot do this for our periodically sampled signal . Periodic mirroring nature of the spectrum prevents one from suppressing the negative components. If we do so, it will vanish the entire spectrum. One solution to this problem is to set the negative half of each spectral period to zero. The resulting spectrum of the analytic signal is shown in Figure 2(c).
Given a record of samples of even length , the procedure to construct the analytic signal is as follows. This method satisfies both the desired properties listed above.
● Compute the -point DTFT of using FFT ● N-point periodic one-sided analytic signal is computed by the following transform
● Finally, the analytic signal (z[n]) is obtained by taking the inverse DTFT of
Matlab
The given procedure can be coded in Matlab using the FFT function. Given a record of real-valued samples , the corresponding analytic signal can be constructed as given next. Note that the Matlab has an inbuilt function to compute the analytic signal. The in-built function is called hilbert.
function z = analytic_signal(x)
%x is a real-valued record of length N, where N is even %returns the analytic signal z[n]
x = x(:); %serialize
N = length(x);
X = fft(x,N);
z = ifft([X(1); 2*X(2:N/2); X(N/2+1); zeros(N/2-1,1)],N);
end
To test this function, we create a 5 seconds record of a real-valued sine signal. The analytic signal is constructed and the orthogonal components are plotted in Figure 3. From the plot, we can see that the real part of the analytic signal is exactly same as the original signal (which is the cosine signal) and the imaginary part of the analytic signal is phase shifted version of the original signal. We note that the imaginary part of the analytic signal is a cosine function with amplitude scaled by which is none other than the Hilbert transform of sine function.
t=0:0.001:0.5-0.001;
x = sin(2*pi*10*t); %real-valued f = 10 Hz
subplot(2,1,1); plot(t,x);%plot the original signal
title('x[n] - original signal'); xlabel('n'); ylabel('x[n]');

z = analytic_signal(x); %construct analytic signal
subplot(2,1,2); plot(t, real(z), 'k'); hold on;
plot(t, imag(z), 'r');
title('Components of Analytic signal');
xlabel('n'); ylabel('z_r[n] and z_i[n]');
legend('Real(z[n])','Imag(z[n])');
Python
Equivalent code in Python is given below (tested with Python 3.6.0)
import numpy as np
def main():
    t = np.arange(start=0,stop=0.5,step=0.001)
    x = np.sin(2*np.pi*10*t)

    import matplotlib.pyplot as plt
    plt.subplot(2,1,1)
    plt.plot(t,x)
    plt.title('x[n] - original signal')
    plt.xlabel('n')
    plt.ylabel('x[n]')

    z = analytic_signal(x)

    plt.subplot(2,1,2)
    plt.plot(t,z.real,'k',label='Real(z[n])')
    plt.plot(t,z.imag,'r',label='Imag(z[n])')
    plt.title('Components of Analytic signal')
    plt.xlabel('n')
    plt.ylabel('z_r[n] and z_i[n]')
    plt.legend()

def analytic_signal(x):
    from scipy.fftpack import fft,ifft
    N = len(x)
    X = fft(x,N)
    h = np.zeros(N)
    h[0] = 1
    h[1:N//2] = 2*np.ones(N//2-1)
    h[N//2] = 1
    Z = X*h
    z = ifft(Z,N)
    return z

if __name__ == '__main__':
    main()
We should note that the hilbert function in Matlab returns the analytic signal $latex z[n]$ not the hilbert transform of the signal. To get the hilbert transform, we should simply get the imaginary part of the analytic signal. Since we have written our own function to compute the analytic signal, getting the hilbert transform of a real-valued signal goes like this.
“What is the best filter that I should use? FIR or IIR ?” is often the question asked by many. There exists two different types of Linear Time Invariant (LTI) filters from transfer function standpoint : FIR (Finite Impulse Response) and IIR (Infinite Impulse Response) filters and myriad design techniques for designing them. The mere fact that there exists so many techniques for designing a filter, suggests that there is no single optimal filter design. One has to weigh-in the pros and cons of choosing a filter design by considering the factors discussed here.
A filter design starts with a specification. We may have a simple specification that just calls for removing an unwanted frequency component or it can be a complete design specification that calls for various parameters like – amount of ripples allowed in passband, stop band attenuation, transition width etc.., The design specification usually calls for satisfying one or more of the following:
● Desired Magnitude response – ● Desired Phase response – ● Tolerance specifications – that specifies how much the filter response is allowed to vary when compared with ideal response. Examples include how much ripples allowed in passband, stop band etc..,
Figure 1: FIR and IIR filters can be realized as direct-form structures. (a) Structure with feed-forward elements only – typical for FIR designs. (b) Structure with feed-back paths – generally results in IIR filters. Other structures like lattice implementations are also available.
Given the specification above, the goal of a filter design process to choose the parameters , , and , such that the transfer function of the filter
yields the desired response: . In other words, the design process also involves choosing the number and location of the zeros zeros () and poles () in the pole-zero plot.
Two types of filter can manifest from the given transfer function above.
● When , there is no feedback in the filter structure, no poles in the pole-zero plot (in fact all the poles sit at the origin). The impulse response of such filter dies out (becomes zero) beyond certain point of time and it is classified as Finite Impulse Response (FIR) filter. It provides linear phase characteristic in the passband. ● When , the filter structure is characterized by the presence of feedback elements. Due to the presence of feedback elements, the impulse response of the filter may not become zero beyond certain point, but continues indefinitely and hence the name Infinite Impulse Response (IIR) filter. ● Caution: In most cases, the presence of feedback elements provide infinite impulse response. It is not always true. There are some exceptional cases where the presence of feedback structure may result in finite impulse response. For example, a moving average filter will have a finite impulse response. The output of a moving average filter can be described using a recursive formula, which will result in a structure with feedback elements.
General considerations in design:
As specified earlier, the choice of filter and the design process depends on design specification, application and the performance issues associates with them. However, the following general considerations are applied in practical design.
Minimizing number of computations
In order to minimize memory requirements for storing the filter co-efficients , and to minimize the number of computations, ideally we would like to be as small as possible. For the same specification, IIR filters result in much lower order when compared to its FIR counter part. Therefore, IIR filters are efficient when viewed from this standpoint.
Need for real-time processing
The given application may require processing of input samples in real-time or the input samples may exist in a recorded state (example: video/audio playback, image processing applications, audio compression). From this perspective, we have two types of filter systems
● Causal Filter — Filter output depends on present and past input samples, not on the future samples. The output may also depend on the past output samples, as in IIR filters. Strictly no future samples. — Such filters are very much suited for real-time applications.
● Non-Causal Filter — There are many practical cases where a non-causal filter is required. Typically, such application warrants some form of post-processing, where the entire data stream is already stored in memory. — In such cases, a filter can be designed that can take in all type of input samples : present, past and future, for processing. These filters are classified as non-causal filters. — Non-causal filters have much simpler design methods.
It can be often seen in many signal processing texts, that the causal filters are practically realizable. That does not mean non-causal filters are not practically implementable. In fact both types of filters are implementable and you can see them in many systems today. The question you must ask is : whether your application requires real-time processing or processing of pre-recorded samples. If the application requires real-time processing, causal filters must be used. Otherwise, non-causal filters can be used.
Consequences of causal filter:
If the application requires real-time processing, causal filters are the only choice for implementation. Following consequences must be considered if causality is desired.
Ideal filters with finite bands of zero response (example: brick-wall filters), cannot be implemented using causal filter structure. A direct consequence of causal filter is that the response cannot be ideal. Hence, we must design the filter that provides a close approximation to the desired response . If tolerance specification is given, it has to be met.
For example, in the case of designing a low pass filter with given passband frequency () and stopband frequencies (), additional tolerance specifications like allowable passband ripple factor (), stopband ripple factor () need to be considered for the design,. Therefore, the practical filter design involves choosing and and then designing the filter with and that satisfies all the given requirements/responses. Often, iterative procedures may be required to satisfy all the above (example: Parks and McClellan algorithm used for designing optimal causal FIR filters [1]).
Figure 2: A sample filter design specification
For a causal filter, frequency response’s real part and the imaginary part become Hilbert transform pair [2]. Hence the magnitude and phase responses become interdependent.
Stability
For a causal LTI digital filter will be BIBO (Bounded Input Bounded Output) stable, if and only if the impulse response is absolutely summable.
Impulse response of FIR filters are always bounded and hence they are inherently stable. On the other hand, an IIR filter may become unstable if not designed properly.
Consider an IIR filter implemented using a floating point processor that has enough accuracy to represent all the coefficients in the transfer function below
The corresponding impulse response is plotted in Figure 3(a). The plot shows that the impulse response decays rapidly to zero as increases. For this case, the sum in equation (2) will be finite. Hence this IIR filter is stable.
Suppose, if we were to implement the same filter in a fixed point processor and we are forced to round-off the co-efficients to 2 digits after the decimal point, the same transfer function looks like this
The corresponding impulse response plotted in Figure 3(b) shows that the impulse response increases rapidly towards a constant value as increases. For this case, the sum in equation (2) will tend to infinity. Hence the implemented IIR filter is unstable.
Figure 3: Impact of poorly implemented IIR filter on stability. (a) Stable IIR filter, (b) The same IIR filter becomes unstable due to rounding effects.
Therefore, it is imperative that an IIR filter implementation need to be tested for stability. To analyze the stability of the filter, the infinite sum in equation (2) need to be computed and it is often difficult to compute this sum. Analysis of pole-zero plot is an alternate solution for this problem. To have a stable causal filter, the poles of the transfer function should lie completely strictlyinside the unit circle on the pole-zero plot. The pole-zero plot for the above given transfer functions , are plotted in Figure 4. It shows that for the transfer function , all the poles lie within the unit circle (the region of stability) and hence it is a stable IIR filter. On the other hand, for the transfer function , one poles lie exactly on the unit circle (ie, it is just out of the region of stability) and hence it is an unstable IIR filter.
In many signal processing applications, it is needed that a digital filter should not alter the angular relationship between the real and imaginary components of a signal, especially in the passband. In otherwords, the phase relationship between the signal components should be preserved in the filter’s passband. If not, we have phase distortion.
Phase distortion is a concern in many signal processing applications. For example, in phase modulations like GMSK [3],the entire demodulation process hinges on the phase relationship between the inphase and quadrature components of the incoming signal. If we have a phase distorting filter in the demodulation chain, the entire detection process goes for a toss. Hence, we have to pay attention to the phase characteristics of such filters. To have no phase distortion when processing a signal through a filter, every spectral component of the signal inside the passband should be delayed by the same amount time delay measured in samples. In other words, the phase response in the passband should be a linear function (straight line) of frequency (except for the phase wraps at the band edges). A filter that satisfies this property is called a linear phase filter. FIR filters provide perfect linear phase characteristic in the passband region (Figure 5) and hence avoids phase distortion. All IIR filters provide non-linear phase characteristic. If a real-time application warrants for zero phase distortion, FIR filters are the immediate choice for design.
It is intuitive to see the phase response of a generalized linear phase filter should follow the relationship , where is the slope and is the intercept when viewing the linear relationship between the frequency and the phase response in the passband (Figure 5). The phase delay and group delay are the important filter characteristics considered for ascertaining the phase distortion and they relate to the intercept and the slope of the phase response in the passband. Linear phase filters are characterized by constant group delay. Any deviation in the group delay from the constant value inside the passband, indicates presence of certain degree of non-linearity in the phase and hence causes phase distortion.
Figure 5: FIR filter showing linear phase characteristics in the passband
Phase delay is the time delay experienced by each spectral component of the input signal. For a filter with the frequency response , the phase delay response defined in terms of phase response as
Group delay is the delay experienced by a group of spectral components within a narrow frequency interval about [4]. The group delay response is defined as the negative derivative of the phase response .
For the generalized linear phase filter, the group delay and phase delay are given by
Summary of design choices
● IIR filters are efficient, they can provide similar magnitude response for fewer coefficients or lower sidelobes for same number of coefficients ● For linear phase requirement, FIR filters are the immediate choice for the design ● FIR filters are inherently stable. IIR filters are susceptible to finite length words effects of fixed point arithmetic and hence the design has to be rigorously tested for stability. ● IIR filters provide less average delay compared to its equivalent FIR counterpart. If the filter has to be used in a feedback path in a system, the amount of filter delay is very critical as it affects the stability of the overall system. ● Given a specification, an IIR design can be easily deduced based on closed-form expressions. However, satisfying the design requirements using an FIR design generally requires iterative procedures.
Rate this article: Note: There is a rating embedded within this post, please visit this post to rate it.
A brief intro to modeling a frequency selective fading channel using tapped delay line (TDL) filters. Rayleigh & Rician frequency-selective fading channel models explained.
Tapped delay line filters
Tapped-delay line filters (FIR filters) are best to simulate multiple echoes originating from same source. Hence they can be used to model multipath scenarios. Tapped-Delay-Line (TDL) filters with number taps can be used to simulate a multipath frequency selective fading channel. Frequency selective channels are characterized by time varying nature of the channel. For simulating a frequency selective channel, it is mandatory to have N > 1. In contrast, if N = 1, it simulates a zero-mean fading channel where all the multipath signals arrive at the receiver at the same time.
Let be the associated path attenuation corresponding to the received power and propagation delay of the th path. In continuous time, the complex path attenuation is given by
The complex channel response is given by
In the equation above, the attenuation and path delay vary with time. This simulates a time-variant complex channel.
As a special case, in the absence any movements or other changes in the transmission channel, the channel can remain fairly time invariant (fixed channel with respect to instantaneous time ) even though the multipath is present. Thus the time-invariant complex channel becomes
Usually, the pair is described as a Power Delay Profile (PDP) plot. A sample power delay profile plot for a fixed, discrete, three ray model with its corresponding implementation using a tapped-delay line filter is shown in the following figure
Figure 1: 3-ray multipath time-invariant channel and its equivalent TDL implementation (path attenuations and propagation delays are fixed)
Choose underlying distribution:
The next level of modeling involves, introduction of randomness in the above mentioned model there by rendering the channel response time variant. If the path attenuations are typically drawn from a complex Gaussian random variable, then at any given time , the absolute value of the impulse response is
● Rayleigh distributed – if the mean of the distribution ● Rician distributed – if the mean of the distribution
Respectively, these two scenarios model the presence or absence of a Line of Sight (LOS) path between the transmitter and the receiver. The first propagation delay has no effect on the model behavior and hence it can be removed.
Similarly, the propagation delays can also be randomized, resulting in a more realistic but extremely complex model to implement. Furthermore, the power-delay-profile specifications with arbitrary time delays, warrant non-uniformly spaced tapped-delay-line filters, that are not suitable for practical simulation. For ease of implementation, the given PDP model with arbitrary time delays can be converted to tractable uniformly spaced statistical model by a combination of interpolation/approximation/uniform-sampling of the given power-delay-profile.
Real-life modelling:
Usually continuous domain equations for modeling multipath are specified in standards like COST-207 model in GSM specification. Such continuous time power-delay-profile models can be simulated using discrete-time Tapped Delay Line (TDL) filter with number of taps with variable tap gains. Given the order , the problem boils down to determining the discrete tap spacing and the path gains , in such a way that the simulated channel closely follows the specified multipath PDP characteristics. A survey of method to find a solution for this problem can be found in [2].
Rate this article: Note: There is a rating embedded within this post, please visit this post to rate it.
Small-scale Models for Multipath Effects
● Introduction
● Statistical characteristics of multipath channels
□ Mutipath channel models
□ Scattering function
□ Power delay profile
□ Doppler power spectrum
□ Classification of small-scale fading
● Rayleigh and Rice processes
□ Probability density function of amplitude
□ Probability density function of frequency
● Modeling frequency flat channel
● Modeling frequency selective channel
□ Method of equal distances (MED) to model specified power delay profiles
□ Simulating a frequency selective channel using TDL model
Synopsis: Cyclic prefix in OFDM, tricks a natural channel to perform circular convolution. This simplifies equalizer design at the receiver. Hands-on demo in Matlab.
Cyclic Prefix-ed OFDM
A cyclic-prefixed OFDM(CP-OFDM) transceiver architecture is typically implemented using inverse discrete Fourier transform (IDFT) and discrete Fourier transform (DFT) blocks (refer Figure 13.3). In an OFDM transmitter, the modulated symbols are assigned to individual subcarriers and sent to an IDFT block. The output of the IDFT block, generally viewed as time domain samples, results in an OFDM symbol. Such OFDM symbols are then transmitted across a channel with certain channel impulse response (CIR). On the other hand, the receiver applies DFT over the received OFDM symbols for further demodulation of the information in the individual subcarriers.
In reality, a multipath channel or any channel in nature acts as a linear filter on the transmitted OFDM symbols. Mathematically, the transmitted OFDM symbol (denoted as gets linearly convolved with the CIR and gets corrupted with additive white gaussian noise – designated as . Denoting linear convolution as ‘‘, the received signal in discrete-time can be represented as
The idea behind using OFDM is to combat frequency selective fading, where different frequency components of a transmitted signal can undergo different levels of fading. The OFDM divides the available spectrum in to small chunks called sub-channels. Within the subchannels, the fading experienced by the individual modulated symbol can be considered flat. This opens-up the possibility of using a simple frequency domain equalizer to neutralize the channel effects in the individual subchannels.
Circular convolution and designing a simple frequency domain equalizer
From one of the DFT properties, we know that the circular convolution of two sequences in time domain is equivalent to the multiplication of their individual responses in frequency domain.
Let and are two sequences of length with their DFTs denoted as and respectively. Denoting circular convolution as ,
If we ignore channel noise in the OFDM transmission, the received signal is written as
We can note that the channel performs a linear convolution operation on the transmitted signal. Instead, if the channel performs circular convolution (which is not the case in nature) then the equation would have been
By applying the DFT property given in equation 2,
As a consequence, the channel effects can be neutralized at the receiver using a simple frequency domain equalizer (actually this is a zero-forcing equalizer when viewed in time domain) that just inverts the estimated channel response and multiplies it with the frequency response of the received signal to obtain the estimates of the OFDM symbols in the subcarriers as
Demonstrating the role of Cyclic Prefix
The simple frequency domain equalizer shown in equation 6 is possible only if the channel performs circular convolution. But in nature, all channels perform linear convolution. The linear convolution can be converted into circular convolution by adding Cyclic Prefix (CP) in the OFDM architecture. The addition of CP makes the linear convolution imparted by the channel appear as circular convolution to the DFT process at the receiver (Reference [1]).
Let’s understand this by demonstration.
To simply stuffs, we will create two randomized vectors for and . is of length , the channel impulse response is of length and we intend to use -point DFT/IDFT wherever applicable.
N=8; %period of DFT
s = randn(1,8);
h = randn(1,3);
>> s =   -0.0155    2.5770    1.9238   -0.0629   -0.8105    0.6727   -1.5924   -0.8007
>> h =   -0.4878   -1.5351    0.2355
Now, convolve the vectors and linearly and circularly. The outputs are plotted in Figure 1. We note that the linear convolution and the circular convolution does not yield identical results.
lin_s_h = conv(h,s) %linear convolution of h and s
cir_s_h = cconv(h,s,N) % circular convolution of h and s with period N
Figure 1: Difference between linear convolution and circular convolution
Let’s append a cyclic prefix to the signal by copying last symbols from and pasting it to its front. Since the channel delay is 3 symbols (CIR of length 3), we need to add atleast 2 CP symbols.
Ncp = 2; %number of symbols to copy and paste for CP
s_cp = [s(end-Ncp+1:end) s]; %copy last Ncp symbols from s and prefix it.
Compare the outputs due to cir_s_h and lin_scp_h. We can immediately recognize that that the middle section of lin_scp_h is exactly same as the cir_s_h vector. This is shown in the figure 2.
We have just tricked the channel to perform circular convolution by adding a cyclic extension to the OFDM symbol. At the receiver, we are only interested in the middle section of the lin_scp_h which is the channel output. The first block in the OFDM receiver removes the additional symbols from the front and back of the channel output. The resultant vector is the received symbol r after the removal of cyclic prefix in the receiver.
r = lin_scp_h(Ncp+1:N+Ncp)%cut from index Ncp+1 to N+Ncp
Verifying DFT property
The DFT property given in equation 5 can be re-written as
To verify this in Matlab, take N-point DFTs of the received signal and CIR. Then, we can see that the IDFT of product of DFTs of and will be equal to the N-point circular convolution of and
R = fft(r,N); %frequency response of received signal
H = fft(h,N); %frequency response of CIR
S = fft(s,N); %frequency response of OFDM signal (non CP)

r1 = ifft(S.*H); %IFFT of product of individual DFTs

display(['IFFT(DFT(H)*DFT(S)) : ',num2str(r1)])
display([cconv(s,h): ', numstr(r)])
In the previous post, Interpretation of frequency bins, frequency axis arrangement (fftshift/ifftshift) for complex DFT were discussed. In this post, I intend to show you how to interpret FFT results and obtain magnitude and phase information.
Outline
For the discussion here, lets take an arbitrary cosine function of the form \(x(t)= A cos \left(2 \pi f_c t + \phi \right)\) and proceed step by step as follows
● Represent the signal \(x(t)\) in computer (discrete-time) and plot the signal (time domain) ● Represent the signal in frequency domain using FFT (\( X[k]\)) ● Extract amplitude and phase information from the FFT result ● Reconstruct the time domain signal from the frequency domain samples
Consider a cosine signal of amplitude \(A=0.5\), frequency \(f_c=10 Hz\) and phase \(phi= \pi/6\) radians (or \(30^{\circ}\) )
\[x(t) = 0.5 cos \left( 2 \pi 10 t + \pi/6 \right)\]
In order to represent the continuous time signal \(x(t)\) in computer memory, we need to sample the signal at sufficiently high rate (according to Nyquist sampling theorem). I have chosen a oversampling factor of \(32\) so that the sampling frequency will be \(f_s = 32 \times f_c \), and that gives \(640\) samples in a \(2\) seconds duration of the waveform record.
A = 0.5; %amplitude of the cosine wave
fc=10;%frequency of the cosine wave
phase=30; %desired phase shift of the cosine in degrees
fs=32*fc;%sampling frequency with oversampling factor 32
t=0:1/fs:2-1/fs;%2 seconds duration

phi = phase*pi/180; %convert phase shift in degrees in radians
x=A*cos(2*pi*fc*t+phi);%time domain signal with phase shift

figure; plot(t,x); %plot the signal
Represent the signal in frequency domain using FFT
Lets represent the signal in frequency domain using the FFT function. The FFT function computes \(N\)-point complex DFT. The length of the transformation \(N\) should cover the signal of interest otherwise we will some loose valuable information in the conversion process to frequency domain. However, we can choose a reasonable length if we know about the nature of the signal.
For example, the cosine signal of our interest is periodic in nature and is of length \(640\) samples (for 2 seconds duration signal). We can simply use a lower number \(N=256\) for computing the FFT. In this case, only the first \(256\) time domain samples will be considered for taking FFT. No need to worry about loss of information in this case, as the \(256\) samples will have sufficient number of cycles using which we can calculate the frequency information.
N=256; %FFT size
X = 1/N*fftshift(fft(x,N));%N-point complex DFT
In the code above, \(fftshift\) is used only for obtaining a nice double-sided frequency spectrum that delineates negative frequencies and positive frequencies in order. This transformation is not necessary. A scaling factor \(1/N\) was used to account for the difference between the FFT implementation in Matlab and the text definition of complex DFT.
3a. Extract amplitude of frequency components (amplitude spectrum)
The FFT function computes the complex DFT and the hence the results in a sequence of complex numbers of form \(X_{re} + j X_{im}\). The amplitude spectrum is obtained
\[|X[k]| = \sqrt{X_{re}^2 + X_{im}^2 } \]
For obtaining a double-sided plot, the ordered frequency axis (result of fftshift) is computed based on the sampling frequency and the amplitude spectrum is plotted.
df=fs/N; %frequency resolution
sampleIndex = -N/2:N/2-1; %ordered index for FFT plot
f=sampleIndex*df; %x-axis index converted to ordered frequencies
stem(f,abs(X)); %magnitudes vs frequencies
xlabel('f (Hz)'); ylabel('|X(k)|');
3b. Extract phase of frequency components (phase spectrum)
Extracting the correct phase spectrum is a tricky business. I will show you why it is so. The phase of the spectral components are computed as
That equation looks naive, but one should be careful when computing the inverse tangents using computers. The obvious choice for implementation seems to be the \(atan\) function in Matlab. However, usage of \(atan\) function will prove disastrous unless additional precautions are taken. The \(atan\) function computes the inverse tangent over two quadrants only, i.e, it will return values only in the \([-\pi/2 , \pi/2]\) interval. Therefore, the phase need to be unwrapped properly. We can simply fix this issue by computing the inverse tangent over all the four quadrants using the \(atan2(X_{img},X_{re})\) function.
Lets compute and plot the phase information using \(atan2\) function and see how the phase spectrum looks
phase=atan2(imag(X),real(X))*180/pi; %phase information
plot(f,phase); %phase vs frequencies
The phase spectrum is completely noisy. Unexpected !!!. The phase spectrum is noisy due to fact that the inverse tangents are computed from the \(ratio\) of imaginary part to real part of the FFT result. Even a small floating rounding off error will amplify the result and manifest incorrectly as useful phase information (read how a computer program approximates very small numbers).
To understand, print the first few samples from the FFT result and observe that they are not absolute zeros (they are very small numbers in the order \(10^{-16}\). Computing inverse tangent will result in incorrect results.
The solution is to define a tolerance threshold and ignore all the computed phase values that are below the threshold.
X2=X;%store the FFT results in another array
%detect noise (very small numbers (eps)) and ignore them
threshold = max(abs(X))/10000; %tolerance threshold
X2(abs(X)<threshold) = 0; %maskout values that are below the threshold
phase=atan2(imag(X2),real(X2))*180/pi; %phase information
plot(f,phase); %phase vs frequencies
The recomputed phase spectrum is plotted below. The phase spectrum has correctly registered the \(30^{\circ}\) phase shift at the frequency \(f=10 Hz\). The phase spectrum is anti-symmetric (\(\phi=-30^{\circ}\) at \(f=-10 Hz\) ), which is expected for real-valued signals.
Reconstruct the time domain signal from the frequency domain samples
Reconstruction of the time domain signal from the frequency domain sample is pretty straightforward
x_recon = N*ifft(ifftshift(X),N); %reconstructed signal
t = [0:1:length(x_recon)-1]/fs; %recompute time index
plot(t,x_recon);%reconstructed signal
The reconstructed signal has preserved the same initial phase shift and the frequency of the original signal. Note: The length of the reconstructed signal is only \(256\) sample long (\(\approx 0.8\) seconds duration), this is because the size of FFT is considered as \(N=256\). Since the signal is periodic it is not a concern. For more complicated signals, appropriate FFT length (better to use a value that is larger than the length of the signal) need to be used.
Rate this post: Note: There is a rating embedded within this post, please visit this post to rate it.
Often, one is confronted with the problem of converting a time domain signal to frequency domain and vice-versa. Fourier Transform is an excellent tool to achieve this conversion and is ubiquitously used in many applications. In signal processing, a time domain signal can be continuous or discrete and it can be aperiodic or periodic. This gives rise to four types of Fourier transforms.
Table 1: Four types of Fourier Transforms
From Table 1, we note note that when the signal is discrete in one domain, it will be periodic in other domain. Similarly, if the signal is continuous in one domain, it will be aperiodic (non-periodic) in another domain. For simplicity, let’s not venture into the specific equations for each of the transforms above. We will limit our discussion to DFT, that is widely available as part of software packages like Matlab, Scipy(python) etc.., however we can approximate other transforms using DFT.
Real and Complex versions of transforms
For each of the listed transforms above, there exist a real version and complex version. The real version of the transform, takes in a real numbers and gives two sets of real frequency domain points – one set representing coefficients over \(cosine\) basis function and the other set representing the co-efficient over \(sine\) basis function. The complex version of the transforms represent positive and negative frequencies in a single array. The complex versions are flexible that it can process both complex valued signals and real valued signals. The following figure captures the difference between real DFT and complex DFT.
Figure 1: Real and complex DFT
Real DFT:
Consider the case of N-point \(real\) DFT , it takes in N samples of (real-valued) time domain waveform \(x[n]\) and gives two arrays of length \(N/2+1\) each set projected on cosine and sine functions respectively.
Caveat: When using the synthesis equation, the values \(X_{re}[0]\) and \(X_{re}[N/2] \) must be divided by two. This problem is due to the fact that we restrict the analysis to real-values only. These type of problems can be avoided by using complex version of DFT.
Complex DFT:
Consider the case of N-point complex DFT, it takes in N samples of complex-valued time domain waveform \(x[n]\) and produces an array \(X[k]\) of length N.
\[ X[k]= \displaystyle{\sum_{n=0}^{N-1} x[n] e^{-j2 \pi k n/N}}\]
The arrays values are interpreted as follows
● \(X[0]\) represents DC frequency component ● Next \(N/2\) terms are positive frequency components with \(X[N/2]\) being the Nyquist frequency (which is equal to half of sampling frequency) ● Next \(N/2-1\) terms are negative frequency components (note: negative frequency components are the phasors rotating in opposite direction, they can be optionally omitted depending on the application)
The corresponding synthesis equation (reconstruct \(x[n]\) from frequency domain samples \(X[k]\)) is
\[x[n]= \displaystyle{ \frac{1}{N} \sum_{k=0}^{N-1} X[k] e^{j2 \pi k n/N}} \]
From these equations we can see that the real DFT is computed by projecting the signal on cosine and sine basis functions. However, the complex DFT projects the input signal on exponential basis functions (Euler’s formula connects these two concepts).
When the input signal in the time domain is real valued, the complex DFT zero-fills the imaginary part during computation (That’s its flexibility and avoids the caveat needed for real DFT). The following figure shows how to interpret the raw FFT results in Matlab that computes complex DFT. The specifics will be discussed next with an example.
Figure 2: Interpretation of frequencies in complex DFT output
Fast Fourier Transform (FFT)
The FFT function in Matlab is an algorithm published in 1965 by J.W.Cooley and J.W.Tuckey for efficiently calculating the DFT. It exploits the special structure of DFT when the signal length is a power of 2, when this happens, the computation complexity is significantly reduced. FFT length is generally considered as power of 2 – this is called \(radix-2\) FFT which exploits the twiddle factors. The FFT length can be odd as used in this particular FFT implementation – Prime-factor FFT algorithm where the FFT length factors into two co-primes.
FFT is widely available in software packages like Matlab, Scipy etc.., FFT in Matlab/Scipy implements the complex version of DFT. Matlab’s FFT implementation computes the complex DFT that is very similar to above equations except for the scaling factor. For comparison, the Matlab’s FFT implementation computes the complex DFT and its inverse as
The Matlab commands that implement the above equations are FFT and IFFT) respectively. The corresponding syntax is as follows
X = fft(x,N) %compute X[k]
x = ifft(X,N) %compute x[n]
Interpreting the FFT results
Lets assume that the \(x[n]\) is the time domain cosine signal of frequency \(f_c=10Hz\) that is sampled at a frequency \(f_s=32*fc\) for representing it in the computer memory.
fc=10;%frequency of the carrier
fs=32*fc;%sampling frequency with oversampling factor=32
t=0:1/fs:2-1/fs;%2 seconds duration
x=cos(2*pi*fc*t);%time domain signal (real number)
subplot(3,1,1); plot(t,x);hold on; %plot the signal
title('x[n]=cos(2 \pi 10 t)'); xlabel('n'); ylabel('x[n]');
Figure 3: A 2 seconds record of 10 Hz cosine wave
Lets consider taking a \(N=256\) point FFT, which is the \(8^{th}\) power of \(2\).
N=256; %FFT size
X = fft(x,N);%N-point complex DFT
%output contains DC at index 1, Nyquist frequency at N/2+1 th index
%positive frequencies from index 2 to N/2
%negative frequencies from index N/2+1 to N
Note: The FFT length should be sufficient to cover the entire length of the input signal. If \(N\) is less than the length of the input signal, the input signal will be truncated when computing the FFT. In our case, the cosine wave is of 2 seconds duration and it will have 640 points (a \(10Hz\) frequency wave sampled at 32 times oversampling factor will have \(2 \times 32 \times 10 = 640\) samples in 2 seconds of the record). Since our input signal is periodic, we can safely use \(N=256\) point FFT, anyways the FFT will extend the signal when computing the FFT (see additional topic on spectral leakage that explains this extension concept).
Due to Matlab’s index starting at 1, the DC component of the FFT decomposition is present at index 1.
>>X(1)
 1.1762e-14   (approximately equal to zero)
That’s pretty easy. Note that the index for the raw FFT are integers from \(1 \rightarrow N\). We need to process it to convert these integers to \(frequencies\). That is where the \(sampling\) frequency counts.
Each point/bin in the FFT output array is spaced by the frequency resolution \(\Delta f\) that is calculated as
\[ \Delta f = \frac{f_s}{N} \]
where, \(f_s\) is the sampling frequency and \(N\) is the FFT size that is considered. Thus, for our example, each point in the array is spaced by the frequency resolution
Now, the \(10 Hz\) cosine signal will leave a spike at the 8th sample (\(10/1.25=8\)), which is located at index 9 (See next figure).
>> abs(X(8:10)) %display samples 7 to 9
ans = 0.0000  128.0000    0.0000
Therefore, from the frequency resolution, the entire frequency axis can be computed as
%calculate frequency bins with FFT
df=fs/N %frequency resolution
sampleIndex = 0:N-1; %raw index for FFT plot
f=sampleIndex*df; %x-axis index converted to frequencies
Now we can plot the absolute value of the FFT against frequencies as
The following plot shows the frequency axis and the sample index as it is for the complex FFT output.
Figure 4: Magnitude response from FFT output plotted against sample index (top) and computed frequencies (bottom)
After the frequency axis is properly transformed with respect to the sampling frequency, we note that the cosine signal has registered a spike at \(10 Hz\). In addition to that, it has also registered a spike at \(256-8=248^{th}\) sample that belongs to negative frequency portion. Since we know the nature of the signal, we can optionally ignore the negative frequencies. The sample at the Nyquist frequency (\(f_s/2\)) mark the boundary between the positive and negative frequencies.
Note that the complex numbers surrounding the Nyquist index are complex conjugates and they represent positive and negative frequencies respectively.
FFTShift
From the plot we see that the frequency axis starts with DC, followed by positive frequency terms which is in turn followed by the negative frequency terms. To introduce proper order in the x-axis, one can use FFTshift function Matlab, which arranges the frequencies in order: negative frequencies \(\rightarrow\) DC \(\rightarrow\) positive frequencies. The fftshift function need to be carefully used when \(N\) is odd.
For even N, the original order returned by FFT is as follows (note: all indices below corresponds to Matlab’s index)
● \(X[1]\) represents DC frequency component ● \(X[2]\) to \(X[N/2]\) terms are positive frequency components ● \(X[N/2+1]\) is the Nyquist frequency (\(F_s/2\)) that is common to both positive and negative frequencies. We will consider it as part of negative frequencies to have the same equivalence with the fftshift function. ● \(X[N/2+1]\) to \(X[N]\) terms are considered as negative frequency components
FFTshift shifts the DC component to the center of the spectrum. It is important to remember that the Nyquist frequency at the (N/2+1)th Matlab index is common to both positive and negative frequency sides. FFTshift command puts the Nyquist frequency in the negative frequency side. This is captured in the following illustration.
Figure 5: Role of FFTShift in ordering the frequencies
Therefore, when \(N\) is even, ordered frequency axis is set as
When (N) is odd, the ordered frequency axis should be set as
\[ f = \Delta f \left[ -\frac{N-1}{2}:1:\frac{N+1}{2}-1 \right] = \frac{f_s}{N} \left[ -\frac{N-1}{2}:1:\frac{N-1}{2}-1 \right]\]
The following code snippet, computes the fftshift using both the manual method and using the Matlab’s in-build command. The results are plotted by superimposing them on each other. The plot shows that both the manual method and fftshift method are in good agreement.
%two-sided FFT with negative frequencies on left and positive frequencies on right
%following works only if N is even, for odd N see equation above
X1 = [(X(N/2+1:N)) X(1:N/2)]; %order frequencies without using fftShift
X2 = fftshift(X);%order frequencies by using fftshift

df=fs/N; %frequency resolution
sampleIndex = -N/2:N/2-1; %raw index for FFT plot
f=sampleIndex*df; %x-axis index converted to frequencies
%plot ordered spectrum using the two methods
figure;subplot(2,1,1);stem(sampleIndex,abs(X1));hold on; stem(sampleIndex,abs(X2),'r') %sample index on x-axis
title('Frequency Domain'); xlabel('k'); ylabel('|X(k)|');%x-axis represent sample index
subplot(2,1,2);stem(f,abs(X1)); stem(f,abs(X2),'r') %x-axis represent frequencies
xlabel('frequencies (f)'); ylabel('|X(k)|');
Comparing the bottom figures in the Figure 4 and Figure 6, we see that the ordered frequency axis is more meaningful to interpret.
IFFTShift
One can undo the effect of fftshift by employing ifftshift function. The ifftshift function restores the raw frequency order. If the FFT output is ordered using fftshift function, then one must restore the frequency components back to original order BEFORE taking IFFT. Following statements are equivalent.
X = fft(x,N) %compute X[k]
x = ifft(X,N) %compute x[n]
X = fftshift(fft(x,N)); %take FFT and rearrange frequency order (this is mainly done for interpretation)
x = ifft(ifftshift(X),N)% restore raw frequency order and then take IFFT
Some observations on FFTShift and IFFTShift
When \(N\) is odd and for an arbitrary sequence, the fftshift and ifftshift functions will produce different results. However, when they are used in tandem, it restores the original sequence.
When \(N\) is even and for an arbitrary sequence, the fftshift and ifftshift functions will produce the same result. When they are used in tandem, it restores the original sequence.
Root Mean Square (RMS) value is the most important parameter that signifies thesize of a signal.
Defining the term “size”:
In signal processing, a signal is viewed as a function of time. The term “size of a signal” is used to represent “strength of the signal”. It is crucial to know the “size” of a signal used in a certain application. For example, we may be interested to know the amount of electricity needed to power a LCD monitor as opposed to a CRT monitor. Both of these applications are different and have different tolerances. Thus the amount of electricity driving these devices will also be different.
A given signal’s size can be measured in many ways. Some of them are,
► Total energy ► Square root of total energy ► Integral absolute value ► Maximum or peak absolute value ► Root Mean Square (RMS) value ► Average Absolute (AA) value
Parseval’s theorem
The Parseval’s theorem expresses the energy of a signal in time-domain in terms of the average energy in its frequency components.
Suppose if the x[n] is a sequence of complex numbers of length N : xn={x0,x1,…,xN-1}, its N-point discrete Fourier transform (DFT): Xk={X0,X1,…,XN-1} is given by
The inverse discrete Fourier transform is given by
Suppose if x[n] and y[n] are two such sequences that follows the above definitions, the Parseval’s theorem is written as
where, indicates conjugate operation.
Deriving Parseval’s theorem
Energy content
Given a discrete-time sequence length N : xn={x0,x1,…,xN-1}, according to Parseval’s theorem, the energy content of the signal in the time-domain is equivalent to the average of the energy contained in its frequency components.
If the samples x[n] and X[k] are real-valued, then
Mean Square value
Mean square value is the arithmetic mean of squares of a given set of numbers. For a complex-valued signal set represented as discrete sampled values – , the mean square xMS value is given as
Applying Parseval’s theorem, the mean square value can also be computed using frequency domain components X[k]
RMS value
RMS value of a signal is calculated as the square root of average of squared value of the signal. For a complex-valued signal set represented as discrete sampled values – , the mean square xRMS value is given as
Applying Parseval’s theorem, the root mean square value can also be computed using frequency domain components X[k]
Implementing in Matlab:
Following Matlab code demonstrates the calculation of RMS value for a random sequence using time-domain and frequency domain approach. Figure 1, depicts the simulation results for RMS values for some well-known waveforms.
N=100; %length of the signal
x=randn(1,N); %a random signal to test
X=fft(x); %Frequency domain representation of the signal

RMS1 = sqrt(mean(x.*conj(x))) %RMS value from time domain samples
RMS2 = sqrt(sum(X.*conj(X))/length(x)^2) %RMS value from frequency domain representation

%Result: RMS1 = 0.9814, RMS2 = 0.9814

%Matlab has inbuilt 'rms' function, it can also be used.
Figure 1: RMS values of some well known signals
Significance of RMS value
► One of the most important parameter that is used to describe the strength of an Alternating Current (AC).
► RMS value of an AC voltage/current is equivalent to the DC voltage/current that produces the same heating effect when applied across an identical resistor. Hence, it is also a measure of energy content in a given signal.
► In statistics, for any zero-mean random stationary signal, the RMS value is same as the standard deviation of the signal. Example : Delay spread of a multipath channel is often calculated as the RMS value of the Power Delay Profile (PDP)
► When two uncorrelated (or orthogonal ) signals are added together, such as noise from two independent sources, the RMS value of their sum is equal to the square-root of sum of the square of their individual RMS values.
Rate this article: Note: There is a rating embedded within this post, please visit this post to rate it.
We live in the age of smart phones that can be loaded with numerous applications to communicate with each other. What’s next ? Where do we go from here ?
Students at MIT Media Labs has answered the call with a novel approach of “Physical Telepresence” that provides the ability to remotely render shapes of objects and people.
Physical telepresence is the result of InFORM interface invented at MIT Media Labs. InForm interface is a self-aware interface, that manipulates not only light but also shapes as well. With this new technology, two remotely connected people can interact with each other by playing a ball game, manipulating shapes/objects together etc..,
In this article, the relationship between SNR-per-bit (Eb/N0) and SNR-per-symbol (Es/N0) are defined with respect to M-ary signaling schemes. Then the complex baseband model for an AWGN channel is discussed, followed by the theoretical error rates of various modulations over the additive white Gaussian noise (AWGN) channel. Finally, the complex baseband models for digital modulators and detectors developed in previous chapter of this book, are incorporated to build a complete communication system model.
Assuming a channel of bandwidth B, received signal power Pr and the power spectral density (PSD) of noise N0/2, the signal to noise ratio (SNR) is given by
Let a signal’s energy-per-bit is denoted as Eb and the energy-per-symbol as Es, then γb=Eb/N0and γs=Es/N0 are the SNR-per-bit and the SNR-per-symbol respectively.
For uncoded M-ary signaling scheme with k = log2(M) bits per symbol, the signal energy per modulated symbol is given by
The SNR per symbol is given by
AWGN channel model
In order to simulate a specific SNR point in performance simulations, the modulated signal from the transmitter needs to be added with random noise of specific strength. The strength of the generated noise depends on the desired SNR level which usually is an input in such simulations. In practice, SNRs are specified in dB. Given a specific SNR point for simulation, let’s see how we can simulate an AWGN channel that adds correct level of white noise to the transmitted symbols.
Figure 1: Simplified simulation model for awgn channel
Consider the AWGN channel model given in Figure 1. Given a specific SNR point to simulate, we wish to generate a white Gaussian noise vector of appropriate strength and add it to the incoming signal. The method described can be applied for both waveform simulations and the complex baseband simulations. In following text, the term SNR (γ) refers to γb = Eb/N0 when the modulation is of binary type (example: BPSK). For multilevel modulations such as QPSK and MQAM, the term SNR refers to γs = Es/N0.
(1) Assume, s is a vector that represents the transmitted signal. We wish to generate a vector r that represents the signal after passing through the AWGN channel. The amount of noise added by the AWGN channel is controlled by the given SNR – γ
(3) Let N denotes the length of the vector s. The signal power for the vector s can be measured as,
(4) The required power spectral density of the noise vector n is computed as
(5) Assuming complex IQ plane for all the digital modulations, the required noise variance (noise power) for generating Gaussian random noise is given by
(6) Generate the noise vector n drawn from normal distribution with mean set to zero and the standard deviation computed from the equation given above
(7) Finally add the generated noise vector (n) to the signal (s)
Matlab code
The following custom function written in Matlab, can be used for adding AWGN noise to an incoming signal. It can be used in waveform simulation as well as complex baseband simulation models.
%author - Mathuranathan Viswanathan (gaussianwaves.com
%This code is part of the books: Wireless communication systems using Matlab & Digital modulations using Matlab.

function [r,n,N0] = add_awgn_noise(s,SNRdB,L)
%Function to add AWGN to the given signal
%[r,n,N0]= add_awgn_noise(s,SNRdB) adds AWGN noise vector to signal
%'s' to generate a %resulting signal vector 'r' of specified SNR
%in dB. It also returns the noise vector 'n' that is added to the
%signal 's' and the spectral density N0 of noise added
%
%[r,n,N0]= add_awgn_noise(s,SNRdB,L) adds AWGN noise vector to
%signal 's' to generate a resulting signal vector 'r' of specified
%SNR in dB. The parameter 'L' specifies the oversampling ratio used
%in the system (for waveform simulation). It also returns the noise
%vector 'n' that is added to the signal 's' and the spectral
%density N0 of noise added
 s_temp=s;
 if iscolumn(s), s=s.'; end; %to return the result in same dim as 's'
 gamma = 10ˆ(SNRdB/10); %SNR to linear scale

 if nargin==2, L=1; end %if third argument is not given, set it to 1

 if isvector(s),
  P=L*sum(abs(s).ˆ2)/length(s);%Actual power in the vector
 else %for multi-dimensional signals like MFSK
  P=L*sum(sum(abs(s).ˆ2))/length(s); %if s is a matrix [MxN]
 end

 N0=P/gamma; %Find the noise spectral density
 if(isreal(s)),
  n = sqrt(N0/2)*randn(size(s));%computed noise
 else
  n = sqrt(N0/2)*(randn(size(s))+1i*randn(size(s)));%computed noise
 end

 r = s + n; %received signal

 if iscolumn(s_temp), r=r.'; end;%return r in original format as s
end
Python code
The following custom function written in Python 3, can be used for adding AWGN noise to an incoming signal. It can be used in waveform simulation as well as complex baseband simulation models.
# author - Mathuranathan Viswanathan (gaussianwaves.com
# This code is part of the book Digital Modulations using Python

from numpy import sum,isrealobj,sqrt
from numpy.random import standard_normal

def awgn(s,SNRdB,L=1):
    """
    AWGN channel
    Add AWGN noise to input signal. The function adds AWGN noise vector to signal 's' to generate a resulting signal vector 'r' of specified SNR in dB. It also
    returns the noise vector 'n' that is added to the signal 's' and the power spectral density N0 of noise added
    Parameters:
        s : input/transmitted signal vector
        SNRdB : desired signal to noise ratio (expressed in dB) for the received signal
        L : oversampling factor (applicable for waveform simulation) default L = 1.
    Returns:
        r : received signal vector (r=s+n)
"""
    gamma = 10**(SNRdB/10) #SNR to linear scale
    if s.ndim==1:# if s is single dimensional vector
        P=L*sum(abs(s)**2)/len(s) #Actual power in the vector
    else: # multi-dimensional signals like MFSK
        P=L*sum(sum(abs(s)**2))/len(s) # if s is a matrix [MxN]
    N0=P/gamma # Find the noise spectral density
    if isrealobj(s):# check if input is real/complex object type
        n = sqrt(N0/2)*standard_normal(s.shape) # computed noise
    else:
        n = sqrt(N0/2)*(standard_normal(s.shape)+1j*standard_normal(s.shape))
    r = s + n # received signal
return r
Theoretical symbol error rates for digital modulations in AWGN channel
Denoting the symbol error rate (SER) as , SNR-per-bit as and SNR-per-symbol as , the symbol error rates for various modulation schemes over AWGN channel are listed in Table 1 (refer [1]).
Table 1: Theoretical symbol error rate for various modulations in AWGN channel
The theoretical symbol error rates are coded as a reusable function. In this implementation, erfc function is used instead of the Q function shown in the Table 4.1. The following equation describes the relationship between the erfc function and the Q function.
Unified simulation model for performance simulation
In the previous chapter of the books, the code implementation for complex baseband models for various digital modulators and demodulator are given. Using these models, we can create a unified simulation code for simulating the performance of various modulation techniques over AWGN channel.
The complete simulation model for performance simulation over AWGN channel is given in Figure 2. The figure is illustrated for a coherent communication system model (applicable for MPSK/MQAM/MPAM modulations)
Figure 2: Complete simulation model for a communication system with AWGN channel
The Matlab code implementing the aforementioned simulation model is given in the books. Here, an unified approach is employed to simulate the performance of any of the given modulation technique – MPSK, MQAM, MPAM or MFSK (MFSK simulation technique is available in the following books: Digital Modulations using Python and Digital Modulations using Matlab).
The simulation code will automatically choose the selected modulation type, performs Monte Carlo simulation, computes symbol error rates and plots them against the theoretical symbol error rates. The simulated performance results obtained for MQAM and MPSK modulations are shown in the Figure 3 and Figure 4.
Figure 3: Simulated symbol error rate performance of M-QAM modulation over AWGN channel
Focus of this article is to discuss the details of Gold code generator using preferred pair m-sequences, implemented using linear feedback shift registers (LFSR). Finally we plot and investigate correlation properties of the generated Gold codes.
Introduction
In a multi-user environment (like spread spectrum, CDMA ) large number of codes with good correlation properties, is a necessity. Gold codes are suited for this application, since a large number of codes with controlled correlation can be generated by a simple time shift of two preferred m-sequences.
Gold sequences belong to the category of product codes where two m-sequences of same length are XOR’ed to produce a Gold sequence. The two m-sequence must maintain the same phase relationship till all the additions are performed. A slight change of phase even in one of the m-sequences, produces a different Gold sequence altogether. Gold codes are non-maximal and therefore they have poor auto-correlation property when compared to that of the underlying m-sequences.
A typical implementation of Gold code generator is shown in Figure 1. Here, the two linear feedback shift registers (LFSR), each of length , are configured to generate two different m-sequences. As we cannot start the LFSRs with all zero values, there need to be some values in the LFSRs. These initial values are controlled by ‘seed 1‘ and ‘seed 2‘. The phase of the m-sequence loaded into an LFSR can be controlled by shifting the initial seed (initial value of the shift registers in the LFSR) there by providing an option to generate a new Gold sequence.
Figure 1: Generation of Gold Code using LFSR
Note that there exists numerous choice of Gold sequences based on the m-sequence configuration of the LFSRs and what is initially loaded into the two LFSRs. Not all the Gold sequences possess good correlation properties. In order to have a Gold code sequence with three valued peak cross-correlation magnitudes, that is both bounded and uniform, the m-sequences generated by the two LFSRs need to be of preferred type.
Algebraic details on generating two preferred m-sequence for Gold code generation is detailed in Gold’s work [1]. It warrants the need for searching the preferred pairs, instead, the configurations given in Table 1 can be used for generating Gold codes that provide optimal correlation properties (three valued correlation as mentioned in Reference [2]). Following points must be noted when choosing the length of LFSR () when generating the Gold code.
● Three valued cross-correlation values occur when is odd or when . ● The peak cross-correlation magnitude achieves the minimum possible value only when is odd (). Therefore, this is the best choice here. ● When , the m-sequences listed in table are still of preferred type (three valued cross-correlation), but the lower bound is weaker when compared to the lower bound when is odd.
Table 1: Preferred pairs of m-sequences
Hardware implementation
A sample hardware implementation for generating a length 127 Gold code – using the preferred pairs ([7,3,2,1],[7,3]) is shown in Figure 2. Here each register in the LFSR is a D-flip flop,all connected in cascaded fashion and operating at a given synchronous clock. Changing the initial seed values into shift registers produces a different set of Gold codes. Matlab code for implementing a Gold code generator is available in this book.
Figure 2: Length 127 – Gold sequence generator with odd n for the preferred pairs – [7,3,2,1], [7,3]
Correlation properties
Figure 3 on this post shows the periodic cross-correlation of two m-sequences that are not a preferred pair. Let’s take a preferred pair from the Table 1 for N = 31 having the feedback connections – [2,3,4,5] and [2,5]. The correlation of two sequences can be computed using the function given in section 12.2.1 of this book.
Figure 3: Normalized cross-correlation of preferred pair m-sequences using the feedback connections [2,3,4,5] and [2,5]
The normalized cross-correlation of the chosen preferred pair and the auto-correlation of the corresponding Gold code is shown in Figure 3 and Figure 4 respectively. The auto-correlation and cross-correlation plots reveal that the Gold code sequence does not possess the excellent auto-correlation property as that of individual m-sequences, but it possess good cross-correlation properties in comparison with the individual m-sequences.
Rate this article: Note: There is a rating embedded within this post, please visit this post to rate it.
Spread spectrum techniques
● Introduction
● Code sequences
□ Sequence correlations
□ Maximum-length sequences (m-sequences)
□ Gold codes
● Direct Sequence Spread Spectrum
□ Simulation of DSSS system
□ Performance of Direct Sequence Spread Spectrum over AWGN channel
□ Performance of Direct Sequence Spread spectrum in the presence of Jammer
● Frequency Hopping Spread Spectrum
□ Simulation model
□ Binary Frequency Shift Keying (BFSK)
□ Allocation of frequency channels
□ Frequency hopping generator
□ Fast and slow frequency hopping
□ Simulation code for BFSK-FHSS
This site uses cookies responsibly. Learn more in our privacy policy.
This website uses cookies to improve your experience while you navigate through the website. Out of these, the cookies that are categorized as necessary are stored on your browser as they are essential for the working of basic functionalities of the website. We also use third-party cookies that help us analyze and understand how you use this website. These cookies will be stored in your browser only with your consent. You also have the option to opt-out of these cookies. But opting out of some of these cookies may affect your browsing experience.
Necessary cookies are absolutely essential for the website to function properly. These cookies ensure basic functionalities and security features of the website, anonymously.
Cookie
Duration
Description
cookielawinfo-checbox-analytics
11 months
This cookie is set by GDPR Cookie Consent plugin. The cookie is used to store the user consent for the cookies in the category "Analytics".
cookielawinfo-checbox-analytics
11 months
This cookie is set by GDPR Cookie Consent plugin. The cookie is used to store the user consent for the cookies in the category "Analytics".
cookielawinfo-checbox-functional
11 months
The cookie is set by GDPR cookie consent to record the user consent for the cookies in the category "Functional".
cookielawinfo-checbox-functional
11 months
The cookie is set by GDPR cookie consent to record the user consent for the cookies in the category "Functional".
cookielawinfo-checbox-others
11 months
This cookie is set by GDPR Cookie Consent plugin. The cookie is used to store the user consent for the cookies in the category "Other.
cookielawinfo-checbox-others
11 months
This cookie is set by GDPR Cookie Consent plugin. The cookie is used to store the user consent for the cookies in the category "Other.
cookielawinfo-checkbox-necessary
11 months
This cookie is set by GDPR Cookie Consent plugin. The cookies is used to store the user consent for the cookies in the category "Necessary".
cookielawinfo-checkbox-performance
11 months
This cookie is set by GDPR Cookie Consent plugin. The cookie is used to store the user consent for the cookies in the category "Performance".
viewed_cookie_policy
11 months
The cookie is set by the GDPR Cookie Consent plugin and is used to store whether or not user has consented to the use of cookies. It does not store any personal data.
Functional cookies help to perform certain functionalities like sharing the content of the website on social media platforms, collect feedbacks, and other third-party features.
Performance cookies are used to understand and analyze the key performance indexes of the website which helps in delivering a better user experience for the visitors.
Analytical cookies are used to understand how visitors interact with the website. These cookies help provide information on metrics the number of visitors, bounce rate, traffic source, etc.


![x[n]](https://s0.wp.com/latex.php?latex=x%5Bn%5D&bg=ffffff&fg=000&s=0&c=20201002)
![x[n] = x(nT)](https://s0.wp.com/latex.php?latex=x%5Bn%5D+%3D+x%28nT%29+&bg=ffffff&fg=000&s=0&c=20201002)

![X(f) = \displaystyle{ T \sum_{n=0}^{N-1} x[n] e^{-j 2 \pi f n T} }\quad (6)](https://s0.wp.com/latex.php?latex=X%28f%29+%3D+%5Cdisplaystyle%7B+T+%5Csum_%7Bn%3D0%7D%5E%7BN-1%7D+x%5Bn%5D+e%5E%7B-j+2+%5Cpi+f+n+T%7D+%7D%5Cquad+%286%29+%C2%A0&bg=ffffff&fg=000&s=2&c=20201002)

![(a) CTFT of continuous signal x(t), (b) Spectrum of x[n] resulted due to periodic sampling and (c) Periodic one-sided spectrum of analytical signal z[n]](https://i0.wp.com/www.gaussianwaves.com/gaussianwaves/wp-content/uploads/2017/04/discrete_time_analytic_signal_PNG.png?resize=594%2C494&ssl=1)
![z[n]](https://s0.wp.com/latex.php?latex=z%5Bn%5D&bg=ffffff&fg=000&s=0&c=20201002)

![z[n] = z_r[n] + j z_i[n]](https://s0.wp.com/latex.php?latex=z%5Bn%5D+%3D+z_r%5Bn%5D+%2B+j+z_i%5Bn%5D&bg=ffffff&fg=000&s=0&c=20201002)

![z_r[n] = x[n]](https://s0.wp.com/latex.php?latex=z_r%5Bn%5D+%3D+x%5Bn%5D&bg=ffffff&fg=000&s=0&c=20201002)

![\displaystyle{ \sum_{n=0}^{N-1} z_r[n] z_i[n] = 0 }](https://s0.wp.com/latex.php?latex=%5Cdisplaystyle%7B+%5Csum_%7Bn%3D0%7D%5E%7BN-1%7D+z_r%5Bn%5D+z_i%5Bn%5D+%3D+0+%7D++&bg=ffffff&fg=000&s=2&c=20201002)


![Z[m]](https://s0.wp.com/latex.php?latex=Z%5Bm%5D&bg=ffffff&fg=000&s=0&c=20201002)

![z[n] = \displaystyle{ \frac{1}{NT} \sum_{m=0}^{N-1} z[m] \; exp \left( j 2 \pi mn/N\right)}](https://s0.wp.com/latex.php?latex=z%5Bn%5D+%3D+%5Cdisplaystyle%7B+%5Cfrac%7B1%7D%7BNT%7D+%5Csum_%7Bm%3D0%7D%5E%7BN-1%7D+z%5Bm%5D+%5C%3B+exp+%5Cleft%28+j+2+%5Cpi+mn%2FN%5Cright%29%7D+&bg=ffffff&fg=000&s=2&c=20201002)


![h[n]](https://s0.wp.com/latex.php?latex=h%5Bn%5D&bg=ffffff&fg=000&s=0&c=20201002)


![h_1[n]](https://s0.wp.com/latex.php?latex=h_1%5Bn%5D&bg=ffffff&fg=000&s=0&c=20201002)


![h_2[n]](https://s0.wp.com/latex.php?latex=h_2%5Bn%5D&bg=ffffff&fg=000&s=0&c=20201002)


![\displaystyle{\tilde{a_n}(t) = a_n(t) exp\left[ -j 2 \pi f_c \tau_n(t) \right]}](https://s0.wp.com/latex.php?latex=%5Cdisplaystyle%7B%5Ctilde%7Ba_n%7D%28t%29+%3D+a_n%28t%29+exp%5Cleft%5B+-j+2+%5Cpi+f_c+%5Ctau_n%28t%29+%5Cright%5D%7D+&bg=ffffff&fg=000&s=2&c=20201002)


![E [h(t; \tau)] = 0](https://s0.wp.com/latex.php?latex=E+%5Bh%28t%3B+%5Ctau%29%5D+%3D+0&bg=ffffff&fg=000&s=0&c=20201002)
![E [h(t; \tau)] \neq 0](https://s0.wp.com/latex.php?latex=E+%5Bh%28t%3B+%5Ctau%29%5D+%5Cneq+0&bg=ffffff&fg=000&s=0&c=20201002)


![s[n]](https://s0.wp.com/latex.php?latex=s%5Bn%5D&bg=ffffff&fg=000&s=0&c=20201002)

![w[n]](https://s0.wp.com/latex.php?latex=w%5Bn%5D&bg=ffffff&fg=000&s=0&c=20201002)


![r[n] = h[n] \ast s[n] + w[n] \;\;\; (\ast \rightarrow linear\;convolution ) \quad\quad (1)](https://s0.wp.com/latex.php?latex=r%5Bn%5D+%3D+h%5Bn%5D+%5Cast+s%5Bn%5D+%2B+w%5Bn%5D+%5C%3B%5C%3B%5C%3B+%28%5Cast+%5Crightarrow+linear%5C%3Bconvolution+%29+%5Cquad%5Cquad+%281%29+&bg=ffffff&fg=000&s=2&c=20201002)
![S[k]](https://s0.wp.com/latex.php?latex=S%5Bk%5D&bg=ffffff&fg=000&s=0&c=20201002)
![H[k]](https://s0.wp.com/latex.php?latex=H%5Bk%5D&bg=ffffff&fg=000&s=0&c=20201002)


![h[n] \circledast s[n] \equiv H[k] S[k] \quad\quad (2)](https://s0.wp.com/latex.php?latex=h%5Bn%5D+%5Ccircledast+s%5Bn%5D+%5Cequiv+H%5Bk%5D+S%5Bk%5D+%5Cquad%5Cquad+%282%29+&bg=ffffff&fg=000&s=2&c=20201002)

![r[n] = h[n] \ast s[n] \quad\quad (\ast \rightarrow linear\;convolution ) \quad\quad (3)](https://s0.wp.com/latex.php?latex=r%5Bn%5D+%3D+h%5Bn%5D+%5Cast+s%5Bn%5D+%5Cquad%5Cquad+%28%5Cast+%5Crightarrow+linear%5C%3Bconvolution+%29+%5Cquad%5Cquad+%283%29+&bg=ffffff&fg=000&s=2&c=20201002)

![r[n] = h[n] \circledast s[n] \quad\quad (\circledast \rightarrow circular\;convolution ) \quad\quad (4)](https://s0.wp.com/latex.php?latex=r%5Bn%5D+%3D+h%5Bn%5D+%5Ccircledast+s%5Bn%5D+%5Cquad%5Cquad+%28%5Ccircledast+%5Crightarrow+circular%5C%3Bconvolution+%29+%5Cquad%5Cquad+%284%29+&bg=ffffff&fg=000&s=2&c=20201002)

![r[n] = h[n] \circledast s[n] \quad\quad \equiv R[k] = H[k] S[k] \quad\quad (5)](https://s0.wp.com/latex.php?latex=r%5Bn%5D+%3D+h%5Bn%5D+%5Ccircledast+s%5Bn%5D+%5Cquad%5Cquad+%5Cequiv+R%5Bk%5D+%3D+H%5Bk%5D+S%5Bk%5D+%5Cquad%5Cquad+%285%29+&bg=ffffff&fg=000&s=2&c=20201002)

![\hat{S}[k] = \frac{R[k]}{H[k]} \quad\quad (6)](https://s0.wp.com/latex.php?latex=%5Chat%7BS%7D%5Bk%5D+%3D+%5Cfrac%7BR%5Bk%5D%7D%7BH%5Bk%5D%7D+%5Cquad%5Cquad+%286%29+&bg=ffffff&fg=000&s=2&c=20201002)


![X[k] = \displaystyle{\sum_{n=0}^{N-1} x[n] e^{-j\frac{2 \pi}{N} k n}}](https://s0.wp.com/latex.php?latex=X%5Bk%5D+%3D+%5Cdisplaystyle%7B%5Csum_%7Bn%3D0%7D%5E%7BN-1%7D+x%5Bn%5D+e%5E%7B-j%5Cfrac%7B2+%5Cpi%7D%7BN%7D+k+n%7D%7D+&bg=ffffff&fg=000&s=1&c=20201002)

![\tilde{x}[n] = \displaystyle{ \frac{1}{N} \sum_{k=0}^{N-1} X[k] e^{j \frac{2 \pi}{N} kn}}](https://s0.wp.com/latex.php?latex=%5Ctilde%7Bx%7D%5Bn%5D+%3D+%5Cdisplaystyle%7B+%5Cfrac%7B1%7D%7BN%7D+%5Csum_%7Bk%3D0%7D%5E%7BN-1%7D+X%5Bk%5D+e%5E%7Bj+%5Cfrac%7B2+%5Cpi%7D%7BN%7D+kn%7D%7D+&bg=ffffff&fg=000&s=1&c=20201002)

![\boxed{ \displaystyle{\sum_{n=0}^{N-1} x[n] y^{\ast}[n] = \frac{1}{N} \sum_{k=0}^{N-1} X[k] Y^{\ast}[k]}}](https://s0.wp.com/latex.php?latex=%5Cboxed%7B+%5Cdisplaystyle%7B%5Csum_%7Bn%3D0%7D%5E%7BN-1%7D+x%5Bn%5D+y%5E%7B%5Cast%7D%5Bn%5D+%3D+%5Cfrac%7B1%7D%7BN%7D+%5Csum_%7Bk%3D0%7D%5E%7BN-1%7D+X%5Bk%5D+Y%5E%7B%5Cast%7D%5Bk%5D%7D%7D+&bg=ffffff&fg=000&s=1&c=20201002)

![\begin{aligned} \sum_{n=0}^{N-1} x[n] y^{\ast}[n] &= \sum_{n=0}^{N-1} x[n] \left(\frac{1}{N} \sum_{k=0}^{N-1} Y[k] e^{j\frac{2 \pi}{N} k n} \right )^\ast \\ &= \frac{1}{N}\sum_{n=0}^{N-1} x[n] \sum_{k=0}^{N-1} Y^\ast[k] e^{-j\frac{2 \pi}{N} k n} \\ &= \frac{1}{N} \sum_{k=0}^{N-1} Y^\ast[k] \cdot \sum_{n=0}^{N-1} x[n] e^{-j\frac{2 \pi}{N} k n} \\ &= \frac{1}{N} \sum_{k=0}^{N-1} X[k] Y^\ast[k] \end{aligned}](https://s0.wp.com/latex.php?latex=%5Cbegin%7Baligned%7D+%5Csum_%7Bn%3D0%7D%5E%7BN-1%7D+x%5Bn%5D+y%5E%7B%5Cast%7D%5Bn%5D+%26%3D+%5Csum_%7Bn%3D0%7D%5E%7BN-1%7D+x%5Bn%5D+%5Cleft%28%5Cfrac%7B1%7D%7BN%7D+%5Csum_%7Bk%3D0%7D%5E%7BN-1%7D+Y%5Bk%5D+e%5E%7Bj%5Cfrac%7B2+%5Cpi%7D%7BN%7D+k+n%7D+%5Cright+%29%5E%5Cast+%5C%5C+%26%3D+%5Cfrac%7B1%7D%7BN%7D%5Csum_%7Bn%3D0%7D%5E%7BN-1%7D+x%5Bn%5D+%5Csum_%7Bk%3D0%7D%5E%7BN-1%7D+Y%5E%5Cast%5Bk%5D+e%5E%7B-j%5Cfrac%7B2+%5Cpi%7D%7BN%7D+k+n%7D+%5C%5C+%26%3D+%5Cfrac%7B1%7D%7BN%7D+%5Csum_%7Bk%3D0%7D%5E%7BN-1%7D+Y%5E%5Cast%5Bk%5D+%5Ccdot+%5Csum_%7Bn%3D0%7D%5E%7BN-1%7D+x%5Bn%5D+e%5E%7B-j%5Cfrac%7B2+%5Cpi%7D%7BN%7D+k+n%7D+%5C%5C+%26%3D+%5Cfrac%7B1%7D%7BN%7D+%5Csum_%7Bk%3D0%7D%5E%7BN-1%7D+X%5Bk%5D+Y%5E%5Cast%5Bk%5D+%5Cend%7Baligned%7D+&bg=ffffff&fg=000&s=1&c=20201002)

![\displaystyle{\sum_{n=0}^{N-1} x[n] x^\ast[n] = \frac{1}{N} \sum_{k=0}^{N-1} X[k] X^{\ast}[k]}](https://s0.wp.com/latex.php?latex=%5Cdisplaystyle%7B%5Csum_%7Bn%3D0%7D%5E%7BN-1%7D+x%5Bn%5D+x%5E%5Cast%5Bn%5D+%3D+%5Cfrac%7B1%7D%7BN%7D+%5Csum_%7Bk%3D0%7D%5E%7BN-1%7D+X%5Bk%5D+X%5E%7B%5Cast%7D%5Bk%5D%7D+&bg=ffffff&fg=000&s=1&c=20201002)

![x[n] x^\ast[n] = |x[n]|^2](https://s0.wp.com/latex.php?latex=x%5Bn%5D+x%5E%5Cast%5Bn%5D+%3D+%7Cx%5Bn%5D%7C%5E2&bg=ffffff&fg=000&s=0&c=20201002)

![\boxed{ \displaystyle{\sum_{n=0}^{N-1} \left| x[n] \right|^2 = \frac{1}{N} \sum_{k=0}^{N-1} \left| X[k] \right|^2 }}](https://s0.wp.com/latex.php?latex=%5Cboxed%7B+%5Cdisplaystyle%7B%5Csum_%7Bn%3D0%7D%5E%7BN-1%7D+%5Cleft%7C+x%5Bn%5D+%5Cright%7C%5E2+%3D+%5Cfrac%7B1%7D%7BN%7D+%5Csum_%7Bk%3D0%7D%5E%7BN-1%7D+%5Cleft%7C+X%5Bk%5D+%5Cright%7C%5E2+%7D%7D++&bg=ffffff&fg=000&s=1&c=20201002)
![[x_0,x_1,\cdots,x_{N-1}]](https://s0.wp.com/latex.php?latex=%5Bx_0%2Cx_1%2C%5Ccdots%2Cx_%7BN-1%7D%5D&bg=ffffff&fg=000&s=0&c=20201002)

![\displaystyle{ x_{MS} = \frac{ |x_0|^2 + |x_1|^2 + \cdots + |x_{N-1}|^2}{N} = \frac{1}{N} \sum_{n=0}^{N-1} |x[n]|^2 }](https://s0.wp.com/latex.php?latex=%5Cdisplaystyle%7B+x_%7BMS%7D+%3D+%5Cfrac%7B+%7Cx_0%7C%5E2+%2B+%7Cx_1%7C%5E2+%2B+%5Ccdots+%2B+%7Cx_%7BN-1%7D%7C%5E2%7D%7BN%7D+%3D+%5Cfrac%7B1%7D%7BN%7D+%5Csum_%7Bn%3D0%7D%5E%7BN-1%7D+%7Cx%5Bn%5D%7C%5E2+%7D+&bg=ffffff&fg=000&s=1&c=20201002)

![\displaystyle{ x_{MS} : \quad \frac{1}{N} \sum_{n=0}^{N-1} |x[n]|^2 = \frac{1}{N^2} \sum_{k=0}^{N-1} \left| X[k] \right|^2}](https://s0.wp.com/latex.php?latex=%5Cdisplaystyle%7B+x_%7BMS%7D+%3A+%5Cquad+%5Cfrac%7B1%7D%7BN%7D+%5Csum_%7Bn%3D0%7D%5E%7BN-1%7D+%7Cx%5Bn%5D%7C%5E2+%3D+%5Cfrac%7B1%7D%7BN%5E2%7D+%5Csum_%7Bk%3D0%7D%5E%7BN-1%7D+%5Cleft%7C+X%5Bk%5D+%5Cright%7C%5E2%7D+&bg=ffffff&fg=000&s=1&c=20201002)

![\displaystyle{ x_{RMS} = \sqrt{\frac{ |x_0|^2 + |x_1|^2 + \cdots + |x_{N-1}|^2}{N}} = \sqrt{\frac{1}{N} \sum_{n=0}^{N-1} |x[n]|^2 }}](https://s0.wp.com/latex.php?latex=%5Cdisplaystyle%7B+x_%7BRMS%7D+%3D+%5Csqrt%7B%5Cfrac%7B+%7Cx_0%7C%5E2+%2B+%7Cx_1%7C%5E2+%2B+%5Ccdots+%2B+%7Cx_%7BN-1%7D%7C%5E2%7D%7BN%7D%7D+%3D+%5Csqrt%7B%5Cfrac%7B1%7D%7BN%7D+%5Csum_%7Bn%3D0%7D%5E%7BN-1%7D+%7Cx%5Bn%5D%7C%5E2+%7D%7D+&bg=ffffff&fg=000&s=1&c=20201002)

![\displaystyle{ x_{RMS}: \quad \sqrt{\frac{1}{N} \sum_{n=0}^{N-1} |x[n]|^2} = \sqrt{\frac{1}{N^2} \sum_{k=0}^{N-1} \left| X[k] \right|^2}}](https://s0.wp.com/latex.php?latex=%5Cdisplaystyle%7B+x_%7BRMS%7D%3A+%5Cquad+%5Csqrt%7B%5Cfrac%7B1%7D%7BN%7D+%5Csum_%7Bn%3D0%7D%5E%7BN-1%7D+%7Cx%5Bn%5D%7C%5E2%7D+%3D+%5Csqrt%7B%5Cfrac%7B1%7D%7BN%5E2%7D+%5Csum_%7Bk%3D0%7D%5E%7BN-1%7D+%5Cleft%7C+X%5Bk%5D+%5Cright%7C%5E2%7D%7D+&bg=ffffff&fg=000&s=1&c=20201002)


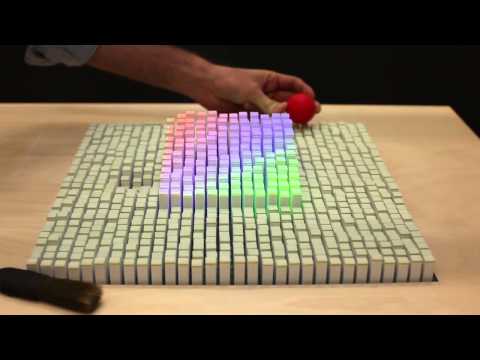


![n=[5,7,9,11,...]](https://s0.wp.com/latex.php?latex=n%3D%5B5%2C7%2C9%2C11%2C...%5D&bg=ffffff&fg=000&s=0&c=20201002)


![Normalized cross-correlation of preferred pair m-sequences using the feedback connections [2,3,4,5] and [2,5]](https://i0.wp.com/www.gaussianwaves.com/gaussianwaves/wp-content/uploads/2019/05/Normalized-cross-correlation-of-preferred-pair-m-sequences.png?resize=543%2C208&ssl=1)

![Autocorrelation of Gold code sequence generated using the preferred pair feedback connections [2,3,4,5] and [2,5]](https://i0.wp.com/www.gaussianwaves.com/gaussianwaves/wp-content/uploads/2019/05/Autocorrelation-of-Gold-code-sequence.png?resize=543%2C197&ssl=1)