QAM modulation: simulate in Matlab & Python

A generic complex baseband simulation technique, to simulate all M-ary QAM modulation techniques is given here. The given simulation code is very generic, and it plots both simulated and theoretical symbol error rates for all M-QAM modulation techniques.

Rectangular QAM from PAM constellation

There exist other constellation shapes (like circular, triangular constellations) that are more efficient (in terms of energy required to achieve same the error probability) than the standard rectangular constellation. Rectangular (symmetric or square) constellations are the preferred choice of implementation due to its simplicity in implementing modulation and demodulation.

In one of the earlier articles, I have discussed the method of constructing constellation for rectangular QAM modulation using Karnaugh-map walks, where the inherent property of Karnaugh-maps is exploited to construct Gray coded QAM symbols.

Any rectangular QAM constellation is equivalent to superimposing two Amplitude Shift Keying (ASK) signals (also called Pulse Amplitude Modulation – PAM) on quadrature carriers. For example, 16-QAM constellation points can be generated from two 4-PAM signals, similarly the 64-QAM constellation points can be generated from two 8-PAM signals.

Signal space constellations for 16-QAM and 64-QAM
Figure 1: Signal space constellations for 16-QAM and 64-QAM

The generic equation to generate PAM signals of dimension D is

For generating 16-QAM, the dimension D of PAM is set to . Thus for constructing a M-QAM constellation, the PAM dimension is set as . Matlab code for dynamically generating M-QAM constellation points based on Karnaugh map Gray code walk is given below. The resulting ideal constellations for Gray coded 16-QAM and 64-QAM are shown in Figure 1.

Matlab code

Full Matlab code available in the book Digital Modulations using Matlab – build simulation models from scratch

function [s,ref]=mqam_modulator(M,d)
%Function to MQAM modulate the vector of data symbols - d
%[s,ref]=mqam_modulator(M,d) modulates the symbols defined by the vector d
% using MQAM modulation, where M specifies order of M-QAM modulation and
% vector d contains symbols whose values range 1:M. The output s is modulated
% output and ref represents reference constellation that can be used in demod
if(((M˜=1) && ˜mod(floor(log2(M)),2))==0), %M not a even power of 2
  error('Only Square MQAM supported. M must be even power of 2');
end
  ref=constructQAM(M); %construct reference constellation
  s=ref(d); %map information symbols to modulated symbols
end

Python code

Full Matlab code available in the book Digital Modulations using Python

class QAMModem(Modem):
    # Derived class: QAMModem
    
    def __init__(self,M):
        
        if (M==1) or (np.mod(np.log2(M),2)!=0): # M not a even power of 2
            raise ValueError('Only square MQAM supported. M must be even power of 2')
        
        n = np.arange(0,M) # Sequential address from 0 to M-1 (1xM dimension)
        a = np.asarray([xˆ(x>>1) for x in n]) #convert linear addresses to Gray code
        D = np.sqrt(M).astype(int) #Dimension of K-Map - N x N matrix
        a = np.reshape(a,(D,D)) # NxN gray coded matrix
        oddRows=np.arange(start = 1, stop = D ,step=2) # identify alternate rows
        
        nGray=np.reshape(a,(M)) # reshape to 1xM - Gray code walk on KMap
        #Construction of ideal M-QAM constellation from sqrt(M)-PAM
        (x,y)=np.divmod(nGray,D) #element-wise quotient and remainder
        Ax=2*x+1-D # PAM Amplitudes 2d+1-D - real axis
        Ay=2*y+1-D # PAM Amplitudes 2d+1-D - imag axis
        constellation = Ax+1j*Ay
        Modem.__init__(self, M, constellation, name='QAM') #set the modem attributes

This article is part of the following books
Digital Modulations using Matlab : Build Simulation Models from Scratch, ISBN: 978-1521493885
Digital Modulations using Python ISBN: 978-1712321638
All books available in ebook (PDF) and Paperback formats

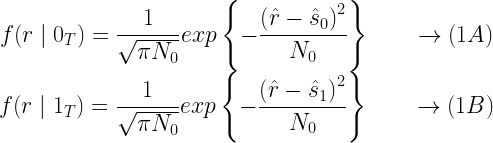
M-QAM demodulation (coherent detection)

Generally the two main categories of detection techniques, commonly applied for detecting the digitally modulated data are coherent detection and non-coherent detection.

In the vector simulation model for the coherent detection, the transmitter and receiver agree on the same
reference constellation for modulating and demodulating the information. The modulators generate the reference constellation for the selected modulation type. The same reference constellation should be used if coherent detection is selected as the method of demodulating the received data vector.

On the other hand, in the non-coherent detection, the receiver is oblivious to the reference constellation used at the transmitter. The receiver uses methods like envelope detection to demodulate the data.

The IQ detection technique is an example of coherent detection. In the IQ detection technique, the first step is to compute the pair-wise Euclidean distance between the given two vectors – reference array and the received symbols corrupted with noise. Each symbol in the received symbol vector (represented on a p-dimensional plane) should be compared with every symbol in the reference array. Next, the symbols, from the reference array, that provide the minimum Euclidean distance are returned.

Let x=(x1,x2,…,xp) and y=(y1,y2,…,yp) be two points in p-dimensional space. The Euclidean distance between them is given by

The pair-wise Euclidean distance between two sets of vectors, say x and y, on a p-dimensional space, can be computed using the vectorized code. The vectorized code returns the ideal signaling points from matrix y that provides the minimum Euclidean distance. Since the vectorized implementation is devoid of nested for-loops, the program executes significantly faster for larger input matrices. The given code is very generic in the sense that it can be easily reused to implement optimum coherent receivers for any N-dimensional digital modulation technique (Please refer the books Digital Modulations using Matlab and Digital Modulations using Python for complete simulation code) .

Matlab code

Full Matlab code available in the book Digital Modulations using Matlab

function [dCap]= mqam_detector(M,r)
%Function to detect MQAM modulated symbols
%[dCap]= mqam_detector(M,r) detects the received MQAM signal points
%points - 'r'. M is the modulation level of MQAM
   if(((M˜=1) && ˜mod(floor(log2(M)),2))==0), %M not a even power of 2
      error('Only Square MQAM supported. M must be even power of 2');
   end
   ref=constructQAM(M); %reference constellation for MQAM
   [˜,dCap]= iqOptDetector(r,ref); %IQ detection
end

Python code

Full Matlab code available in the book Digital Modulations using Python

Performance simulation results

The simulation results for error rate performance of M-QAM modulations over AWGN channel and Rician flat-fading channel is given in the following figures.

Figure 2: Error rate performance of M-QAM modulations in AWGN channel

Rate this article: Note: There is a rating embedded within this post, please visit this post to rate it.

Reference

[1] John G. Proakis, “Digital Communciations”, McGraw-Hill; 5th edition.↗

Related Topics

Digital Modulators and Demodulators - Complex Baseband Equivalent Models
Introduction
Complex baseband representation of modulated signal
Complex baseband representation of channel response
● Modulators for amplitude and phase modulations
 □ Pulse Amplitude Modulation (M-PAM)
 □ Phase Shift Keying Modulation (M-PSK)
 □ Quadrature Amplitude Modulation (M-QAM)
● Demodulators for amplitude and phase modulations
 □ M-PAM detection
 □ M-PSK detection
 □ M-QAM detection
 □ Optimum detector on IQ plane using minimum Euclidean distance
● M-ary FSK modulation and detection
 □ Modulator for M orthogonal signals
 □ M-FSK detection

Books by the author


Wireless Communication Systems in Matlab
Second Edition(PDF)

Note: There is a rating embedded within this post, please visit this post to rate it.
Checkout Added to cart

Digital Modulations using Python
(PDF ebook)

Note: There is a rating embedded within this post, please visit this post to rate it.
Checkout Added to cart

Digital Modulations using Matlab
(PDF ebook)

Note: There is a rating embedded within this post, please visit this post to rate it.
Checkout Added to cart
Hand-picked Best books on Communication Engineering
Best books on Signal Processing

Natural Binary Codes and Gray Codes

Note: There is a rating embedded within this post, please visit this post to rate it.
In a given communication system, we always want to send data that represent real world data representing some physical quantity (be it speech, temperature, etc..,) .The real world physical quantity exist in analog domain and it becomes imperative to convert it to digital domain if we want to send it via a digital communication system. The above process of converting from analog to digital domain is done by an Analog to Digital Converter (ADC). A typical ADC contains the following components/blocks: 1) Sampler 2) Quantizer and 3) Encoder.

The Sampler converts the analog signal (manifestation of real world physical quantities) to sequence of discrete samples that are uniformly spaced in time. For more details on sampling process refer previous sections – 1) Sampling Theorem – Baseband Sampling and 2)Sampling Theorem – bandpass or under sampling .

The sampled signals from the sampling process are discrete in time but their amplitude is still continuous. In order to have a full representation of a signal in digital form, the signal has to be discrete in amplitude too. The amplitude of the sampled signal can take on values from infinite number of possible amplitude levels. This infinite number of possible amplitude has to be mapped to manageable amplitude levels by mapping different ranges of amplitude levels to a set a amplitude levels. This requires the next two blocks in ADC namely the quantizer and the encoder.

The quantizer discretizes the continuous amplitude of the sampled signal to discrete levels of amplitude. Several types of quantizers – uniform, non-uniform (A-law quantizer, law quantizer), differential quantizer, etc exist to fulfill the purpose.

The quantized signal has to be represented in some numeric form to get a digital representation. The encoder, the next block in the ADC, maps the discrete amplitude levels of the quantized samples to codewords. Codewords are just some form of numeric representation that the encoder assigns to each discretized amplitude level. Some of the convenient methods for one-to-one mapping of amplitude levels to codewords include: 1) Natural Binary Coding and 2) Gray coding. In natural binary mapping the discrete amplitude levels are coded in binary format.

Natural Binary Coding:

Consider that the sampler has discretized the samples in time and the quantizer maps discretized ranges of voltages to discrete amplitude levels. The first column in the following tables gives the encoder output in binary. The second column gives possible interpretations. Four commonly known interpretations exists namely – unsigned, signed magnitude, 1’s complement and 2’s complement form. The encoder just spits out the binary pattern and it is up to the designer to decide how to interpret the binary pattern in order to represent quantization values. The interpretation influences the quantizer ranges that will be mapped to specific values. Quantizer design and encoder’s output interpretation always goes hand in hand.

Out of the four common interpretations listed above, unsigned integer representation can represent positive values only. The other three representations can accommodate both positive and negative values.

In signed magnitude representation, also called Folded Binary Code / Foldover Binary Code, the Most Significant Bit (MSB) of the binary pattern represents the sign of the number (positive/negative) and the rest of the bits represent the magnitude. In 1’s complement representation, the negative values are just the 1’s complement of positive values. To convert a binary representation to 1’s complement, one just has to flip all the bits (1’s to 0’s and 0’s to 1’s). To convert to 2’s complement form, convert the binary pattern to 1’s complement and then add ‘1’ to the resulting sum.

The designer can conveniently choose any of the above mentioned forms to interpret the binary output of the encoder. For example, if the designer interprets it as 1’s complement or signed magnitude representation, then he would end-up in having two different representations for the value ‘0’. All the further calculations in DSP has to done by keeping this fact in mind and this poses greater threat to the reliability of design. To avoid this ambiguity, 2’s complement is always the choice of interpretation. Additionally two’s complement interpretation results in faster and simpler hardware. Also it can be noted that given the same number of bits (3 bits) to represent the binary output of the encoder, the two’s complement encoding can represent voltage ranges from -4.5V to +3.5V without any ambiguity. But in the case of signed magnitude and one’s complement encoding the range of representable voltage ranges shrinks to -3.5V to +3.5V but they also result in ambiguity in representing 0V.

Gray Coding:

Gray Coding is another form of representation that is used ubiquitously in all applications. In Gray coding, the adjacent representations (symbols) differ by only one bit. Gray coding, when combined with Forward Error Correction codes capable of corrective single bit errors, it can aid in correction of erroneous reception of bits that spills into adjacent symbols. Digital modulation techniques like M-PSK and M-QAM use Gray coding representation to represent the symbols that are modulated.

Converting from Natural Binary to Gray:

To convert a binary representation (X3 X2 X1 X0) to Gray code (Y3 Y2 Y1 Y0), following method can be used.

$$\begin{matrix}Y_3 = X_3 \;\;\;\;\;\;\;\;\;\\
Y_2 = X_3 \bigoplus X_2 \\
Y_1 = X_2 \bigoplus X_1\\
Y_0 = X_1 \bigoplus X_0 \\ \end{matrix} $$

That is, the MSB (Y3) is same for both binary and Gray codes. The next bit (Y2) is the XOR of previous bit (X3) and the present bit (X2) of the binary code and so on. Following example illustrates this concept using a 6-bit code.

Converting from Gray to Natural Binary:

To convert a Gray code representation (Y3 Y2 Y1 Y0) to binary code (X3 X2 X1 X0), following method can be used.

$$ \begin{matrix}
X_3 = Y_3 \;\;\;\;\;\;\;\;\;\\
X_2 = Y_2 \bigoplus X_3 \\
X_1 = Y_1 \bigoplus X_2\\
X_0 = Y_0 \bigoplus X_1 \\
\end{matrix} $$

That is, the MSB (X3) of binary code is same as that of gray code. The next bit (X2) is the XOR of previous result (X3) and the present bit (Y2) of the gray code and so on. Following example illustrates this concept using 6-bit code.

The following table illustrates the conversion for a three bit system.

Matlab Code:

Matlab Code to convert decimal values directly to Gray

function [grayCoded]=dec2gray(decimalInput)
    [rows,cols]=size(decimalInput);
    grayCoded=zeros(rows,cols);
    for i=1:rows
        for j=1:cols
            grayCoded(i,j)=bitxor(bitshift(decimalInput(i,j),-1),decimalInput(i,j));
        end
    end
end

Matlab Code to convert Gray to decimal values

function [decimal]=gray2dec(grayInput)
    grayInput=uint8(grayInput); %Force datatype to uint8
    [rows,cols]=size(grayInput);
    decimal=zeros(rows,cols);
    for i=1:rows
        for j=1:cols
            temp = bitxor(grayInput(i,j),bitshift(grayInput(i,j),-8));
            temp = bitxor(temp,bitshift(temp,-4));
            temp = bitxor(temp,bitshift(temp,-2));
            temp = bitxor(temp,bitshift(temp,-1));
            decimal(i,j) = temp;
        end
    end
end

Sample Run:

>> decimalInput=[0 1 2 3 4 5 6 7]
decimalInput = 0 1 2 3 4 5 6 7
>> graycoded=dec2gray(decimalInput)
graycoded = 0 1 3 2 6 7 5 4
>> graycoded=gray2dec(graycoded)
graycoded = 0 1 2 3 4 5 6 7

See also:

[1] Oversampling, ADC – DAC Conversion,pulse shaping and Matched Filter
[2] Bandpass Sampling
[3]Baseband or Intermediate Sampling

Non-central Chi square distribution

Note: There is a rating embedded within this post, please visit this post to rate it.

If squares of k independent standard normal random variables are added, it gives rise to central Chi-squared distribution with ‘k’ degrees of freedom. Instead, if squares of k independent normal random variables with non-zero means are added, it gives rise to non-central Chi-squared distribution. Non-central Chi-square distribution is related to Ricean distribution, whereas the central Chi-squared distribution is related to Rayleigh distribution.

The non-central Chi-squared distribution is a generalization of Chi-square distribution. A non-central Chi squared distribution is defined by two parameters: 1) degrees of freedom () and 2) non-centrality parameter .

As we know from previous article, the degrees of freedom specify the number of independent random variables we want to square and sum-up to make the Chi-squared distribution. Non-centrality parameter is the sum of squares of means of the each independent underlying normal random variable.

The non-centrality parameter is given by

The PDF of the non-central Chi-squared distribution having degrees of freedom and non-centrality parameter is given by

Here, the random variable is central Chi-squared distributed with degrees of freedom. The factor gives the probabilities of Poisson distribution. Thus, the PDF of the non-central Chi-squared distribution can be termed as the weighted sum of Chi-squared probabilities where the weights being equal to the probabilities of Poisson distribution.

Method of Generating non-central Chi-squared random variable:

The procedure for generating the samples from a non-central Chi-squared random variable is as follows.

● For a given degree of freedom , let the normal random variables be with variances and mean respectively.
● The goal is to add squares of these independent normal random variables with variances set to one and means satisfying the condition set by equation (1).
● Set and
● Generate standard normal random variables and one normal random variable with and
● Squaring and summing-up all the random variables gives the non-central Chi-squared random variable.
● The PDF of the generated samples can be plotted using the histogram method described here.

Matlab Code:

Check this book for full Matlab code.
Wireless Communication Systems using Matlab – by Mathuranathan Viswanathan

Python Code:

Python numpy package has a nocentral_chisquare() generator, which can be used in a straightforward manner to obtain the non-central Chi square distributed sequences.

#---------Non-central Chi square distribution gaussianwaves.com-----
import numpy as np
import matplotlib.pyplot as plt
#%matplotlib inline
plt.style.use('ggplot')

ks=np.asarray([2,4]) #degrees of freedoms to simulate
ldas = np.asarray([1,2,3]) #non-centrality parameters to simulate
nSamp=1000000 #number of samples to generate

fig, ax = plt.subplots(ncols=1, nrows=1, constrained_layout=True)

for i,k in enumerate(ks):
    for j,lda in enumerate(ldas):
        #Generate non-central Chi-squared distributed random numbers
        X = np.random.noncentral_chisquare(df=k, nonc = lda, size = nSamp)
        ax.hist(X,bins=500,density=True,label=r'$k$={} $\lambda$={}'.format(k,lda),\
        histtype='step',alpha=0.75, linewidth=3)

ax.set_xlim(left=0,right=30);ax.legend()
ax.set_title('PDFs of non-central Chi square distribution');
plt.show()
Figure 1: Simulated PDFs of non-central Chi-Squared random variables

Rate this article: Note: There is a rating embedded within this post, please visit this post to rate it.

For further reading

[1] David A. Harville, “Linear Models and the Relevant Distributions and Matrix Algebra”, 978-1138578333, Chapman and Hall/CRC, 1 edition, March 2018.↗

Similar topics

Random Variables - Simulating Probabilistic Systems
● Introduction
Plotting the estimated PDF
● Univariate random variables
 □ Uniform random variable
 □ Bernoulli random variable
 □ Binomial random variable
 □ Exponential random variable
 □ Poisson process
 □ Gaussian random variable
 □ Chi-squared random variable
 □ Non-central Chi-Squared random variable
 □ Chi distributed random variable
 □ Rayleigh random variable
 □ Ricean random variable
 □ Nakagami-m distributed random variable
Central limit theorem - a demonstration
● Generating correlated random variables
 □ Generating two sequences of correlated random variables
 □ Generating multiple sequences of correlated random variables using Cholesky decomposition
Generating correlated Gaussian sequences
 □ Spectral factorization method
 □ Auto-Regressive (AR) model

Books by the author


Wireless Communication Systems in Matlab
Second Edition(PDF)

Note: There is a rating embedded within this post, please visit this post to rate it.
Checkout Added to cart

Digital Modulations using Python
(PDF ebook)

Note: There is a rating embedded within this post, please visit this post to rate it.
Checkout Added to cart

Digital Modulations using Matlab
(PDF ebook)

Note: There is a rating embedded within this post, please visit this post to rate it.
Checkout Added to cart
Hand-picked Best books on Communication Engineering
Best books on Signal Processing

Chi square distribution – demystified

Note: There is a rating embedded within this post, please visit this post to rate it.

A random variable is always associated with a probability distribution. When the random variable undergoes mathematical transformation the underlying probability distribution no longer remains the same. Consider a random variable whose probability distribution function (PDF) is a standard normal distribution ( and ). Now, if the random variable is squared (a mathematical transformation), then the PDF of is no longer a standard normal distribution. The new transformed distribution is called Chi square Distribution with degree of freedom. The PDF of and are plotted in Figure 1.

Figure 1: Transformation of Normal Distribution to Chi Square Distribution

The mean of the random variable is and for the transformed variable Z2, the mean is given by . Similarly, the variance of the random variable is , whereas the variance of the transformed random variable is . In addition to the mean and variance, the shape of the distribution is also changed. The distribution of the transformed variable is no longer symmetric. In fact, the distribution is skewed to one side. Also the random variable can take only positive values whereas the random variable can take negative values too (note the x-axis in the plots above).

Since the new transformation is based on only one parameter (), the degree of freedom for this transformation is . Therefore, the transformed random variable follows – “Chi-square distribution with degree of freedom”.
Suppose, if are independent random variables that follows standard normal distribution( and ), then the transformation,

is a Chi square distribution with k degrees of freedom. The following figure illustrates how the definition of the Chi square distribution as a transformation of normal distribution for degree of freedom and degrees of freedom. In the same manner, the transformation can be extended to degrees of freedom.

Figure 2: Illustration of Chi-square Distribution with 2 degrees of freedom

The above equation is derived from random variables that follow standard normal distribution. For a standard normal distribution, the mean . Therefore, the transformation is called central Chi-square distribution. If, the underlying random variables follow normal distribution with non-zero mean, then the transformation is called non-central Chi-square distribution [2] . In channel modeling, the central Chi-squared distribution is related to Rayleigh Fading scenario and the non-central Chi-square distribution is related to Rician Fading scenario.

Mathematically, the PDF of the central Chi-squared distribution with degrees of freedom is given by

The mean and variance of the central Chi-squared distributed random variable is given by

Relation to Rayleigh distribution

The connection between Chi square distribution and the Rayleigh distribution can be established as follows

  1. If a random variable has standard Rayleigh distribution, then the transformation follows chi-square distribution with degrees of freedom.
  2. If a random variable has the chi-square distribution with degrees of freedom, then the transformation has standard Rayleigh distribution.

Applications:

Chi-square distribution is used in hypothesis testing (to compare the observed data with expected data that follows a specific hypothesis) and in estimating variances of a parameter.

Matlab Simulation:

Check this book for full Matlab code.
Wireless Communication Systems using Matlab – by Mathuranathan Viswanathan

Figure 3: Simulated output – central Chi square Distribution with k degrees of freedom

Python Code

Python numpy package has a chisquare() generator, which can be used in a straightforward manner to obtain the Chi square distributed sequences.

#---------Chi square distribution gaussianwaves.com-----
import numpy as np
import matplotlib.pyplot as plt
#%matplotlib inline
plt.style.use('ggplot')

ks=np.arange(start=1,stop=6,step=1) #degrees of freedoms to simulate
nSamp=1000000 #number of samples to generate

fig, ax = plt.subplots(ncols=1, nrows=1, constrained_layout=True)

for i,k in enumerate(ks):
    #Generate central Chi-square distributed random numbers
    X = np.random.chisquare(df=k, size = nSamp)
    ax.hist(X,bins=500,density=True,label=r'$k$={}'.format(k), \
    histtype='step',alpha=0.75, linewidth=3)

ax.set_xlim(left=0,right=8);ax.set_ylim(bottom=0,top=0.5);ax.legend();
ax.set_title('PDFs of Chi square distribution');
ax.set_xlabel(r'$\chi_k^2$');ax.set_ylabel(r'$f_{\chi_k^2}(x)$');
plt.show()

Rate this article: Note: There is a rating embedded within this post, please visit this post to rate it.

For further reading

[1] Ernie Croot, “Notes on Chi-squared distribution”, Georgia institute of technology, School of mathematics, Oct 2005.↗

Similar topics

Random Variables - Simulating Probabilistic Systems
● Introduction
Plotting the estimated PDF
● Univariate random variables
 □ Uniform random variable
 □ Bernoulli random variable
 □ Binomial random variable
 □ Exponential random variable
 □ Poisson process
 □ Gaussian random variable
 □ Chi-squared random variable
 □ Non-central Chi-Squared random variable
 □ Chi distributed random variable
 □ Rayleigh random variable
 □ Ricean random variable
 □ Nakagami-m distributed random variable
Central limit theorem - a demonstration
● Generating correlated random variables
 □ Generating two sequences of correlated random variables
 □ Generating multiple sequences of correlated random variables using Cholesky decomposition
Generating correlated Gaussian sequences
 □ Spectral factorization method
 □ Auto-Regressive (AR) model

Books by the author


Wireless Communication Systems in Matlab
Second Edition(PDF)

Note: There is a rating embedded within this post, please visit this post to rate it.
Checkout Added to cart

Digital Modulations using Python
(PDF ebook)

Note: There is a rating embedded within this post, please visit this post to rate it.
Checkout Added to cart

Digital Modulations using Matlab
(PDF ebook)

Note: There is a rating embedded within this post, please visit this post to rate it.
Checkout Added to cart
Hand-picked Best books on Communication Engineering
Best books on Signal Processing

Uniform random variable

Note: There is a rating embedded within this post, please visit this post to rate it.

Uniform random variables are used to model scenarios where the expected outcomes are equi-probable. For example, in a communication system design, the set of all possible source symbols are considered equally probable and therefore modeled as a uniform random variable.

The uniform distribution is the underlying distribution for an uniform random variable. A continuous uniform random variable, denoted as , take continuous values within a given interval , with equal probability. Therefore, the PDF of such a random variable is a constant over the given interval is.

This article is part of the book
Wireless Communication Systems in Matlab (second edition), ISBN: 979-8648350779 available in ebook (PDF) format and Paperback (hardcopy) format.

$$  f_X(x) = \begin{cases}\frac{1}{b-a} & \text{when } a < x < b\\0 & \text{otherwise} \end{cases} $$

In Matlab, rand function generates continuous uniform random numbers in the interval . The rand function picks a random number in the interval in which the probability of occurrence of all the numbers in the interval are equally likely. The command rand(n,m) will generate a matrix of size . To generate a random number in the interval one can use the following expression.

a + (b-a)*rand(n,m); %Here nxm is the size of the output matrix

To test whether the numbers generated by the continuous uniform distribution are uniform in the interval , one has to generate very large number of values using the rand function and then plot the histogram. The Figure 1 shows that the simulated PDF and theoretical PDF are in agreement with each other.

a=2;b=10; %open interval (2,10)
X=a+(b-a)*rand(1,1000000);%simulate uniform RV
[p,edges]=histcounts(X,'Normalization','pdf');%estimated PDF
outcomes = 0.5*(edges(1:end-1) + edges(2:end));%possible outcomes
g=1/(b-a)*ones(1,length(outcomes)); %Theoretical PDF
bar(outcomes,p);hold on;plot(outcomes,g,'r-');
title('Probability Density Function');legend('simulated','theory');
xlabel('Possible outcomes');ylabel('Probability of outcomes');
Figure 1: Continuous uniform random variable : histogram and theoretical PDF

On the other hand, a discrete random variable generates discrete values that are equally probable. The underlying discrete uniform distribution is denoted as , where , is a finite set of discrete elements that are equally probable as described by the probability mass function (PMF)

$$ f_X(x)= \begin{cases}\frac{1}{n} & \text{where } x \in {s_1,s_2,…,s_n } \\ 0 & otherwise \end{cases} $$

There exist several methods to generate discrete uniform random numbers and two of them are discussed here. The straightforward method is to use randi function in Matlab that can generate discrete uniform numbers in the integer set . The second method is to use rand function and ceil the result to discrete values. For example, the command to generate uniformly distributed discrete numbers from the set is

X=ceil(n*rand(1,100));

The uniformity test for discrete uniform random numbers can be performed and it is very similar to the code shown for the continuous uniform random variable case. The only difference here is the normalization term. The histogram values should not be normalized by the total area under the histogram curve as in the case of continuous random variables. Rather, the histogram should be normalized by the total number of occurrences in all the bins. We cannot normalized based on the area under the curve, since the bin values are not dense enough (bins are far from each other) for proper calculation of total area. The code snippet is given next. The resulting plot (Figure 2) shows a good match between the simulated and theoretical PMFs.

X=randi(6,100000,1); %Simulate throws of dice,S={1,2,3,4,5,6}
[pmf,edges]=histcounts(X,'Normalization','pdf');%estimated PMF
outcomes = 0.5*(edges(1:end-1) + edges(2:end));%S={1,2,3,4,5,6}
g=1/6*ones(1,6); %Theoretical PMF
bar(outcomes,pmf);hold on;stem(outcomes,g,'r-');
title('Probability Mass Function');legend('simulated','theory');
xlabel('Possible outcomes');ylabel('Probability of outcomes');
Note: There is a rating embedded within this post, please visit this post to rate it.

Topics in this chapter

Random Variables - Simulating Probabilistic Systems
● Introduction
Plotting the estimated PDF
● Univariate random variables
 □ Uniform random variable
 □ Bernoulli random variable
 □ Binomial random variable
 □ Exponential random variable
 □ Poisson process
 □ Gaussian random variable
 □ Chi-squared random variable
 □ Non-central Chi-Squared random variable
 □ Chi distributed random variable
 □ Rayleigh random variable
 □ Ricean random variable
 □ Nakagami-m distributed random variable
Central limit theorem - a demonstration
● Generating correlated random variables
 □ Generating two sequences of correlated random variables
 □ Generating multiple sequences of correlated random variables using Cholesky decomposition
Generating correlated Gaussian sequences
 □ Spectral factorization method
 □ Auto-Regressive (AR) model

Books by the author


Wireless Communication Systems in Matlab
Second Edition(PDF)

Note: There is a rating embedded within this post, please visit this post to rate it.
Checkout Added to cart

Digital Modulations using Python
(PDF ebook)

Note: There is a rating embedded within this post, please visit this post to rate it.
Checkout Added to cart

Digital Modulations using Matlab
(PDF ebook)

Note: There is a rating embedded within this post, please visit this post to rate it.
Checkout Added to cart
Hand-picked Best books on Communication Engineering
Best books on Signal Processing

Minimum-variance unbiased estimator (MVUE)

As discussed in the introduction to estimation theory, the goal of an estimation algorithm is to give an estimate of random variable(s) that is unbiased and has minimum variance. This criteria is reproduced here for reference

In the above equations f0 is the transmitted carrier frequency and is the estimated frequency based on a set of observed data (See previous article).

Existence of minimum-variance unbiased estimator (MVUE):

The estimator described above is called minimum-variance unbiased estimator (MVUE) since, the estimates are unbiased as well as they have minimum variance. Sometimes there may not exist any MVUE for a given scenario or set of data. This can happen in two ways
1) No existence of unbiased estimators
2) Even if we have unbiased estimator, none of them gives uniform minimum variance.

Consider that we have three unbiased estimators g1, g2 and g3 that gives estimates of a deterministic parameter θ. Let the unbiased estimates be , and respectively.

Figure 1 illustrates two scenarios for the existence of an MVUE among the three estimators. In Figure 1a, the third estimator gives uniform minimum variance compared to other two estimators. In Figure 1b, none of the estimator gives minimum variance that is uniform across the entire range of θ.

Figure 1: Illustration of existence of Minimum Variable Unbiased Estimator (MVUE)

Methods to find MVU Estimator:

1) Determine Cramer-Rao Lower Bound (CRLB) and check if some estimator satisfies it. If an estimator exists whose variance equals the CRLB for each value of θ, then it must be the MVU estimator. It may happen that no estimator exists that achieve CRLB.

2) Use Rao-Blackwell-Lechman-Scheffe (RBLS) Theorem: Find a sufficient statistic and find a function of the sufficient statistic. This function gives the MVUE. This approach is rarely used in practice.

3) Restrict the solution to find linear estimators that are unbiased. This gives Minimum Variance Linear Unbiased Estimator (MVLUE). This method gives MVLUE only if the problem is truly linear.

Rate this article: Note: There is a rating embedded within this post, please visit this post to rate it.

For further study

[1] Notes on Cramer-Rao Lower Bound (CRLB).↗
[2] Notes on Rao-Blackwell-Lechman-Scheffe (RBLS) Theorem.↗

See Also

[1]An Introduction to Estimation Theory
[2]Bias of an Estimator
[3]Minimum Variance Unbiased Estimators (MVUE)
[4]Maximum Likelihood Estimation
[5]Maximum Likelihood Decoding
[6]Probability and Random Process
[7]Likelihood Function and Maximum Likelihood Estimation (MLE)
[8]Score, Fisher Information and Estimator Sensitivity
[9]Introduction to Cramer Rao Lower Bound (CRLB)
[10]Cramer Rao Lower Bound for Scalar Parameter Estimation
[11]Applying Cramer Rao Lower Bound (CRLB) to find a Minimum Variance Unbiased Estimator (MVUE)
[12]Efficient Estimators and CRLB
[13]Cramer Rao Lower Bound for Phase Estimation
[14]Normalized CRLB - an alternate form of CRLB and its relation to estimator sensitivity
[15]Cramer Rao Lower Bound (CRLB) for Vector Parameter Estimation
[16]The Mean Square Error – Why do we use it for estimation problems
[17]How to estimate unknown parameters using Ordinary Least Squares (OLS)
[18]Essential Preliminary Matrix Algebra for Signal Processing
[19]Why Cholesky Decomposition ? A sample case:
[20]Tests for Positive Definiteness of a Matrix
[21]Solving a Triangular Matrix using Forward & Backward Substitution
[22]Cholesky Factorization - Matlab and Python
[23]LTI system models for random signals – AR, MA and ARMA models
[24]Comparing AR and ARMA model - minimization of squared error
[25]Yule Walker Estimation
[26]AutoCorrelation (Correlogram) and persistence – Time series analysis
[27]Linear Models - Least Squares Estimator (LSE)
[28]Best Linear Unbiased Estimator (BLUE)

Books by the author


Wireless Communication Systems in Matlab
Second Edition(PDF)

Note: There is a rating embedded within this post, please visit this post to rate it.
Checkout Added to cart

Digital Modulations using Python
(PDF ebook)

Note: There is a rating embedded within this post, please visit this post to rate it.
Checkout Added to cart

Digital Modulations using Matlab
(PDF ebook)

Note: There is a rating embedded within this post, please visit this post to rate it.
Checkout Added to cart
Hand-picked Best books on Communication Engineering
Best books on Signal Processing

MPSK modulation: simulate in Matlab & Python

A generic complex baseband simulation technique, to simulate all M-ary phase shift keying (M-PSK) modulation techniques is given here. The given simulation code is very generic, and it plots both simulated and theoretical symbol error rates for all MPSK modulation techniques.

M-ary phase shift keying (M-PSK) modulation

In phase shift keying, all the information gets encoded in the phase of the carrier signal. The M-PSK modulator transmits a series of information symbols drawn from the set m∈{1,2,…,M}. Each transmitted symbol holds k bits of information (k=log2(M)). The information symbols are modulated using M-PSK mapping.

Figure 1: Signal space constellations for various MPSK modulations

The general expression for a M-PSK signal set is given by

Here, M denotes the modulation order and it defines the number of constellation points in the reference constellation. The value of M depends on the parameter k – the number of bits we wish to squeeze in a single MPSK symbol. For example if we wish to squeeze in 3 bits (k=3) in one transmit symbol, then M = 2k = 23 = 8 and this results in 8-PSK configuration. M=2 gives binary phase shift keying (BPSK) configuration. The configuration with M=4 is referred as quadrature phase shift keying (QPSK). The parameter A is the amplitude scaling factor. Using trigonometric identity, equation (1) can be separated into cosine and sine basis functions as follows

This can be expressed as a combination of in-phase and quadrature phase components on an I-Q plane as

Normalizing the amplitude as , the points on the reference constellation will be placed on the unit circle. The MPSK modulator is constructed based on this equation and the ideal constellations for M=4,8 and 16 PSK modulations are shown in Figure 1.

Matlab code

Full Matlab code available in the book Digital Modulations using Matlab – build simulation models from scratch

function [s,ref]=mpsk_modulator(M,d)
%Function to MPSK modulate the vector of data symbols - d
%[s,ref]=mpsk_modulator(M,d) modulates the symbols defined by the
%vector d using MPSK modulation, where M specifies the order of
%M-PSK modulation and the vector d contains symbols whose values
%in the range 1:M. The output s is the modulated output and ref
%represents the reference constellation that can be used in demod
   ref_i= 1/sqrt(2)*cos(((1:1:M)-1)/M*2*pi);
   ref_q= 1/sqrt(2)*sin(((1:1:M)-1)/M*2*pi);
   ref = ref_i+1i*ref_q;
   s = ref(d); %M-PSK Mapping
end

Python code

Full Python code available in the book Digital Modulations using Python

modem.py: PSK modem - derived class
class PSKModem(Modem):
	# Derived class: PSKModem
	def __init__(self, M):
		#Generate reference constellation
		m = np.arange(0,M) #all information symbols m={0,1,...,M-1}
		I = 1/np.sqrt(2)*np.cos(m/M*2*np.pi)
		Q = 1/np.sqrt(2)*np.sin(m/M*2*np.pi)
		constellation = I + 1j*Q #reference constellation
		Modem.__init__(self, M, constellation, name='PSK') #set the modem attributes
.
.
.

This article is part of the following books
Digital Modulations using Matlab : Build Simulation Models from Scratch, ISBN: 978-1521493885
Digital Modulations using Python ISBN: 978-1712321638
All books available in ebook (PDF) and Paperback formats

M-PSK demodulation (coherent detection)

Generally the two main categories of detection techniques, commonly applied for detecting the digitally modulated data are coherent detection and non-coherent detection.

In the vector simulation model for the coherent detection, the transmitter and receiver agree on the same
reference constellation for modulating and demodulating the information. The modulators generate the reference constellation for the selected modulation type. The same reference constellation should be used if coherent detection is selected as the method of demodulating the received data vector.

On the other hand, in the non-coherent detection, the receiver is oblivious to the reference constellation used at the transmitter. The receiver uses methods like envelope detection to demodulate the data.

The IQ detection technique is an example of coherent detection. In the IQ detection technique, the first step is to compute the pair-wise Euclidean distance between the given two vectors – reference array and the received symbols corrupted with noise. Each symbol in the received symbol vector (represented on a p-dimensional plane) should be compared with every symbol in the reference array. Next, the symbols, from the reference array, that provide the minimum Euclidean distance are returned.

Let x=(x1,x2,…,xp) and y=(y1,y2,…,yp) be two points in p-dimensional space. The Euclidean distance between them is given by

The pair-wise Euclidean distance between two sets of vectors, say x and y, on a p-dimensional space, can be computed using the vectorized code. The vectorized code returns the ideal signaling points from matrix y that provides the minimum Euclidean distance. Since the vectorized implementation is devoid of nested for-loops, the program executes significantly faster for larger input matrices. The given code is very generic in the sense that it can be easily reused to implement optimum coherent receivers for any N-dimensional digital modulation technique (Please refer the books Digital Modulations using Matlab and Digital Modulations using Python for complete simulation code) .

Matlab code

Full Matlab code available in the book Digital Modulations using Matlab

function [dCap]= mpsk_detector(M,r)
%Function to detect MPSK modulated symbols
%[dCap]= mpsk_detector(M,r) detects the received MPSK signal points
%points - 'r'. M is the modulation level of MPSK
   ref_i= 1/sqrt(2)*cos(((1:1:M)-1)/M*2*pi);
   ref_q= 1/sqrt(2)*sin(((1:1:M)-1)/M*2*pi);
   ref = ref_i+1i*ref_q; %reference constellation for MPSK
   [˜,dCap]= iqOptDetector(r,ref); %IQ detection
end

Python code

Full Python code available in the book Digital Modulations using Python

Performance simulation results

The simulation results for error rate performance of M-PSK modulations over AWGN channel and Rayleigh flat-fading channel is given in the following figures.

Figure 2: Error rate performance of MPSK modulations in AWGN channel

Rate this article: Note: There is a rating embedded within this post, please visit this post to rate it.

Reference

[1] John G. Proakis, “Digital Communciations”, McGraw-Hill; 5th edition.↗

Related Topics

Digital Modulators and Demodulators - Complex Baseband Equivalent Models
Introduction
Complex baseband representation of modulated signal
Complex baseband representation of channel response
● Modulators for amplitude and phase modulations
 □ Pulse Amplitude Modulation (M-PAM)
 □ Phase Shift Keying Modulation (M-PSK)
 □ Quadrature Amplitude Modulation (M-QAM)
● Demodulators for amplitude and phase modulations
 □ M-PAM detection
 □ M-PSK detection
 □ M-QAM detection
 □ Optimum detector on IQ plane using minimum Euclidean distance
● M-ary FSK modulation and detection
 □ Modulator for M orthogonal signals
 □ M-FSK detection

Books by the author


Wireless Communication Systems in Matlab
Second Edition(PDF)

Note: There is a rating embedded within this post, please visit this post to rate it.
Checkout Added to cart

Digital Modulations using Python
(PDF ebook)

Note: There is a rating embedded within this post, please visit this post to rate it.
Checkout Added to cart

Digital Modulations using Matlab
(PDF ebook)

Note: There is a rating embedded within this post, please visit this post to rate it.
Checkout Added to cart
Hand-picked Best books on Communication Engineering
Best books on Signal Processing

Derive BPSK BER – optimum receiver in AWGN channel

Key focus: Derive BPSK BER (bit error rate) for optimum receiver in AWGN channel. Explained intuitively step by step.

BPSK modulation is the simplest of all the M-PSK techniques. An insight into the derivation of error rate performance of an optimum BPSK receiver is essential as it serves as a stepping stone to understand the derivation for other comparatively complex techniques like QPSK,8-PSK etc..

Understanding the concept of Q function and error function is a pre-requisite for this section of article.

The ideal constellation diagram of a BPSK transmission (Figure 1) contains two constellation points located equidistant from the origin. Each constellation point is located at a distance from the origin, where Es is the BPSK symbol energy. Since the number of bits in a BPSK symbol is always one, the notations – symbol energy (Es) and bit energy (Eb) can be used interchangeably (Es=Eb).

Assume that the BPSK symbols are transmitted through an AWGN channel characterized by variance = N0/2 Watts. When 0 is transmitted, the received symbol is represented by a Gaussian random variable ‘r‘ with mean=S0 = and variance =N0/2. When 1 is transmitted, the received symbol is represented by a Gaussian random variable – r with mean=S1= and variance =N0/2. Hence the conditional density function of the BPSK symbol (Figure 2) is given by,

Figure 1: BPSK – ideal constellation
Figure 2: Probability density function (PDF) for BPSK Symbols

 An optimum receiver for BPSK can be implemented using a correlation receiver or a matched filter receiver (Figure 3). Both these forms of implementations contain a decision making block that decides upon the bit/symbol that was transmitted based on the observed bits/symbols at its input.

Figure 3: Optimum Receiver for BPSK

When the BPSK symbols are transmitted over an AWGN channel, the symbols appears smeared/distorted in the constellation depending on the SNR condition of the channel. A matched filter or that was previously used to construct the BPSK symbols at the transmitter. This process of projection is illustrated in Figure 4. Since the assumed channel is of Gaussian nature, the continuous density function of the projected bits will follow a Gaussian distribution. This is illustrated in Figure 5.

Figure 4: Role of correlation/Matched Filter

After the signal points are projected on the basis function axis, a decision maker/comparator acts on those projected bits and decides on the fate of those bits based on the threshold set. For a BPSK receiver, if the a-prior probabilities of transmitted 0’s and 1’s are equal (P=0.5), then the decision boundary or threshold will pass through the origin. If the apriori probabilities are not equal, then the optimum threshold boundary will shift away from the origin.

Figure 5: Distribution of received symbols

Considering a binary symmetric channel, where the apriori probabilities of 0’s and 1’s are equal, the decision threshold can be conveniently set to T=0. The comparator, decides whether the projected symbols are falling in region A or region B (see Figure 4). If the symbols fall in region A, then it will decide that 1 was transmitted. It they fall in region B, the decision will be in favor of ‘0’.

For deriving the performance of the receiver, the decision process made by the comparator is applied to the underlying distribution model (Figure 5). The symbols projected on the axis will follow a Gaussian distribution. The threshold for decision is set to T=0. A received bit is in error, if the transmitted bit is ‘0’ & the decision output is ‘1’ and if the transmitted bit is ‘1’ & the decision output is ‘0’.

This is expressed in terms of probability of error as,


Or equivalently,

By applying Bayes Theorem↗, the above equation is expressed in terms of conditional probabilities as given below,


Since a-prior probabilities are equal P(0T)= P(1T) =0.5, the equation can be re-written as

Intuitively, the integrals represent the area of shaded curves as shown in Figure 6. From the previous article, we know that the area of the shaded region is given by Q function.

Figure 6a, 6b: Calculating Error Probability

Similarly,

From (4), (6), (7) and (8),


For BPSK, since Es=Eb, the probability of symbol error (Ps) and the probability of bit error (Pb) are same. Therefore, expressing the Ps and Pb in terms of Q function and also in terms of complementary error function :


Rate this article: Note: There is a rating embedded within this post, please visit this post to rate it.

Reference

[1] Nguyen & Shwedyk, “A First course in Digital Communications”, Cambridge University Press, 1st edition.↗

Books by author


Wireless Communication Systems in Matlab
Second Edition(PDF)

Note: There is a rating embedded within this post, please visit this post to rate it.
Checkout Added to cart

Digital Modulations using Python
(PDF ebook)

Note: There is a rating embedded within this post, please visit this post to rate it.
Checkout Added to cart

Digital Modulations using Matlab
(PDF ebook)

Note: There is a rating embedded within this post, please visit this post to rate it.
Checkout Added to cart
Hand-picked Best books on Communication Engineering
Best books on Signal Processing

Q function and Error functions : demystified

In simple words, The Q-function gives the probability that a random variable from a normal distribution will exceed a certain threshold value. The erf function gives the probability that a normally distributed variable will fall within a certain range.

Q function

Q functions are often encountered in the theoretical equations for Bit Error Rate (BER) involving AWGN channel. A brief discussion on Q function and its relation to erfc function is given here.

Gaussian process is the underlying model for an AWGN channel.The probability density function of a Gaussian Distribution is given by

\[p(x) = \displaystyle{ \frac{1}{ \sigma \sqrt{2 \pi}} e^{ – \frac{(x-\mu)^2}{2 \sigma^2}}}\quad\quad (1) \]

Generally, in BER derivations, the probability that a Gaussian Random Variable \(X \sim N ( \mu, \sigma^2) \) exceeds \(x_0\) is evaluated as the area of the shaded region as shown in Figure 1.

Figure 1: Gaussian PDF and illustration of Q function

Mathematically, the area of the shaded region is evaluated as,

\[Pr(X \geq x_0) =\displaystyle{ \int_{x_0}^{\infty} p(x) dx = \int_{x_0}^{\infty} \frac{1}{ \sigma \sqrt{2 \pi}} e^{ – \frac{(x-\mu)^2}{2 \sigma^2}} dx } \quad\quad (2) \]

The above probability density function given inside the above integral cannot be integrated in closed form. So by change of variables method, we substitute

\[\displaystyle{ y = \frac{x-\mu}{\sigma} }\]

Then equation (2) can be re-written as,

\[\displaystyle{ Pr\left( y > \frac{x_0-\mu}{\sigma} \right ) = \int_{ \left( \frac{x_{0} -\mu}{\sigma}\right)}^{\infty} \frac{1}{ \sqrt{2 \pi}} e^{- \frac{y^2}{2}} dy } \quad\quad (3) \]

Here the function inside the integral is a normalized gaussian probability density function \(Y \sim N( 0, 1)\), normalized to mean \(\mu=0\) and standard deviation \(\sigma=1\).

The integral on the right side can be termed as Q-function, which is given by,

\[\displaystyle{Q(z) = \int_{z}^{\infty}\frac{1}{ \sqrt{2 \pi}} e^{- \frac{y^2}{2}} dy } \quad\quad (4)\]

Here the Q function is related as,

\[\displaystyle{ Pr\left( y > \frac{x_0-\mu}{\sigma} \right ) = Q\left(\frac{x_0-\mu}{\sigma} \right ) = Q(z)} \quad\quad (5)\]

Thus Q function gives the area of the shaded curve with the transformation \(y = \frac{x-\mu}{\sigma}\) applied to the Gaussian probability density function. Essentially, Q function evaluates the tail probability of normal distribution (area of shaded area in the above figure).

The Q-function gives the probability that a random variable from a normal distribution will exceed a certain threshold value.

Error function

The complementary error function represents the area under the two tails of zero mean Gaussian probability density function of variance \(\sigma^2 = 1/2\). The error function gives the probability that the parameter lies outside that range.

Therefore, the complementary error function is given by

\[\displaystyle{ erfc(z) = \frac{2}{\sqrt{\pi}} \int_{z}^{\infty} e^{-x^2}} dx \quad\quad (6)\]

Hence, the error function is

\[erf(z) = 1 – erfc(z) \quad\quad (7)\]

or equivalently,

\[\displaystyle{ erf(z) = \frac{2}{\sqrt{\pi}} \int_{0}^{z} e^{-x^2} dx } \quad\quad (8) \]

The erf function gives the probability that a normally distributed variable will fall within a certain range.

Q function and Complementary Error Function (erfc)

From the limits of the integrals in equation (4) and (6) one can conclude that Q function is directly related to complementary error function (erfc). It follows from equation (4) and (6), Q function is related to complementary error function by the following relation.

\[\displaystyle{ Q(z) = \frac{1}{2} erfc \left( \frac{z}{\sqrt{2}}\right)} \quad\quad (9) \]

Some important results

Keep a note of the following equations that can come handy when deriving probability of bit errors for various scenarios. These equations are compiled here for easy reference.

If we have a normal variable \(X \sim N (\mu, \sigma^2)\), the probability that \(X > x\) is

\[\displaystyle{ Pr \left( X > x \right) = Q \left( \frac{x-\mu}{\sigma} \right ) } \quad\quad (10) \]

If we want to know the probability that \(X\) is away from the mean by an amount ‘a’ (on the left or right side of the mean), then

\[\displaystyle{ Pr \left( X > \mu+a \right) = Pr \left( X < \mu-a \right) = Q\left(\frac{a}{\sigma} \right ) } \quad\quad (11) \]

If we want to know the probability that X is away from the mean by an amount ‘a’ (on both sides of the mean), then

\[\displaystyle{ Pr \left( \mu-a > X > \mu+a \right) = 2 Q\left(\frac{a}{\sigma} \right ) } \quad\quad (12)\]

Application of Q function in computing the Bit Error Rate (BER) or probability of bit error will be the focus of our next article.

Applications

The Q-function and the error function (erf) are important mathematical functions that arise in many fields, including probability theory, statistics, signal processing, and communications engineering. Here are some reasons why these functions are important:

  1. Probability calculations: The Q-function and erf function are used in probability calculations involving Gaussian distributions. The Q-function gives the probability that a random variable from a normal distribution will exceed a certain threshold value. The erf function gives the probability that a normally distributed variable will fall within a certain range.
  2. Signal processing: In signal processing, the Q-function is used to calculate the probability of bit error in digital communication systems. This is important for designing communication systems that can reliably transmit data over noisy channels.
  3. Statistical analysis: The Q-function and erf function are used in statistical analysis to model data and estimate parameters. For example, in hypothesis testing, the Q-function can be used to calculate p-values.
  4. Mathematical modeling: The Q-function and erf function arise naturally in mathematical models for various phenomena. For example, the heat equation in physics and the Black-Scholes equation in finance both involve the erf function.
  5. Computational efficiency: In some cases, the Q-function and erf function provide a more efficient and accurate way of calculating certain probabilities and integrals than other methods.

Books by the author


Wireless Communication Systems in Matlab
Second Edition(PDF)

Note: There is a rating embedded within this post, please visit this post to rate it.
Checkout Added to cart

Digital Modulations using Python
(PDF ebook)

Note: There is a rating embedded within this post, please visit this post to rate it.
Checkout Added to cart

Digital Modulations using Matlab
(PDF ebook)

Note: There is a rating embedded within this post, please visit this post to rate it.
Checkout Added to cart
Hand-picked Best books on Communication Engineering
Best books on Signal Processing

Estimation Theory : an introduction

Key focus: Understand the basics of estimation theory with a simple example in communication systems. Know how to assess the performance of an estimator.

A simple estimation problem : DSB-AM receiver

In Double Side Band – Amplitude Modulation (DSB-AM), the desired message is amplitude modulated over a carrier of frequency f0. The following discussion is with reference to the figure 1. In the frequency domain, the spectrum of the message signal, which is a baseband signal, may look like the one shown in (a).  After  the modulation over a carrier frequency of f0, the spectrum of the modulated signal will look like as shown in (b). The modulated signal has spectral components centered at f0 and -f0.

Figure 1: Illustrating estimation of unknowns f and Φ using DSB-AM receiver

The modulated signal is a function of three factors :
1) actual message – m(t)
2) carrier frequency –  f0
3) phase uncertainty – Φ0

The modulated signal can be expressed as,

To simplify things, let’s consider that the modulated signal is passed via an ideal channel (no impairments added by the channel, so we can do away with channel equalization and other complex stuffs in the receiver).  The modulated signal hits the antenna located at front end of our DSBC receiver. Usually the receiver front end is employed with a band-pass filter and amplifier to put the received signal in the desired band of operation & level, as expected by the receiver. The electronics in the front end receiver adds noise to the incoming signal (modeled as white noise – w(t) ). The signal after the BPF and amplifier combination is expressed as x(t), which is a combination of our desired signal s(t) and the front end noise w(t). Thus x(t) can be expressed as

The signal x(t) is band-pass (centered around the carrier frequency f0). To bring x(t) back to the baseband, a mixer is employed that multiplies x(t) with a tone centered at f0 (generated by a local oscillator). Actually a low pass filter is usually employed after the mixer, for extracting the desired signal at the baseband.

As the receiver has no knowledge about the carrier frequency, there must exist a technique/method to extract this information from the incoming signal x(t) itself. Not only the carrier frequency (f0) but also the phase Φ0 of the carrier need to be known at the receiver for proper demodulation. This leads us to the problem of “estimation”.

Estimation of unknown parameters

In “estimation” problem, we are confronted with estimating one or more unknown parameters based on a sequence of observed data. In our problem, the signal x(t) is the observed data and the parameters that are to be estimated are  f0 and Φ0 .

Now, we add an estimation algorithm at the receiver, that takes in the signal x(t) and computes estimates of f0 and Φ0.The estimated values are denoted with a cap on their respective letters.The estimation algorithm can be simply stated as follows

Given , estimate and that are optimal in some sense.

Since the noise w(t) is assumed to be “white”, the probability density function (PDF) of the noise is readily available at the receiver.

So far, all the notations were expressed in continuous domain. To simplify calculations, let’s state the estimation problem in discrete time domain. In discrete time domain, the samples of observed signal – which is a combination of actual signal and noise is expressed As

The noise samples w[n] is a random variable, that randomizes every time we observe x[n]. Each time when we observe the “observed” samples – x[n] , we think of it as having the same “actual” signal samples – s[n] but with different realizations of the noise samples w[n]. Thus w[n] can be modeled as a Random Variable (RV). Since the underlying noise w[n] is a random variable, the estimates and that result from the estimation are also random variables.

Now the estimation algorithm can be stated as follows:

Given the observed data samples – x[n] = ( x[0], x[1],x[2], … ,x[N-1] ), our goal is to find estimator functions that maps the given data into estimates.

Assessing the performance of the estimation algorithm

Since the estimates and are random variables, they can be described by a probability density function (PDF). The PDF of the estimates depend on following factors :

1. Structure of s[n]
2. Probability model of w[n]
3. Form of estimation function g(x)

For example, the PDF of the estimate may take the following shape,

Figure 2: Probability Density function of estimate – f

The goal of the estimation algorithm is to give an estimate  that is unbiased (mean of the estimate is equal to the actual f0) and has minimum variance. This criteria can be expressed as,

Same type of argument will hold for the other estimate :

By these criteria one can assess the performance of an estimator. The estimator described above (with the criteria) is called “Minimum Variance Unbiased Estimator” (MVUE).

Rate this article: Note: There is a rating embedded within this post, please visit this post to rate it.

Similar topics

[1]An Introduction to Estimation Theory
[2]Bias of an Estimator
[3]Minimum Variance Unbiased Estimators (MVUE)
[4]Maximum Likelihood Estimation
[5]Maximum Likelihood Decoding
[6]Probability and Random Process
[7]Likelihood Function and Maximum Likelihood Estimation (MLE)
[8]Score, Fisher Information and Estimator Sensitivity
[9]Introduction to Cramer Rao Lower Bound (CRLB)
[10]Cramer Rao Lower Bound for Scalar Parameter Estimation
[11]Applying Cramer Rao Lower Bound (CRLB) to find a Minimum Variance Unbiased Estimator (MVUE)
[12]Efficient Estimators and CRLB
[13]Cramer Rao Lower Bound for Phase Estimation
[14]Normalized CRLB - an alternate form of CRLB and its relation to estimator sensitivity
[15]Cramer Rao Lower Bound (CRLB) for Vector Parameter Estimation
[16]The Mean Square Error – Why do we use it for estimation problems
[17]How to estimate unknown parameters using Ordinary Least Squares (OLS)
[18]Essential Preliminary Matrix Algebra for Signal Processing
[19]Why Cholesky Decomposition ? A sample case:
[20]Tests for Positive Definiteness of a Matrix
[21]Solving a Triangular Matrix using Forward & Backward Substitution
[22]Cholesky Factorization - Matlab and Python
[23]LTI system models for random signals – AR, MA and ARMA models
[24]Comparing AR and ARMA model - minimization of squared error
[25]Yule Walker Estimation
[26]AutoCorrelation (Correlogram) and persistence – Time series analysis
[27]Linear Models - Least Squares Estimator (LSE)
[28]Best Linear Unbiased Estimator (BLUE)

Books by the author


Wireless Communication Systems in Matlab
Second Edition(PDF)

Note: There is a rating embedded within this post, please visit this post to rate it.
Checkout Added to cart

Digital Modulations using Python
(PDF ebook)

Note: There is a rating embedded within this post, please visit this post to rate it.
Checkout Added to cart

Digital Modulations using Matlab
(PDF ebook)

Note: There is a rating embedded within this post, please visit this post to rate it.
Checkout Added to cart
Hand-picked Best books on Communication Engineering
Best books on Signal Processing